Tag: Greater Wichita Partnership
-
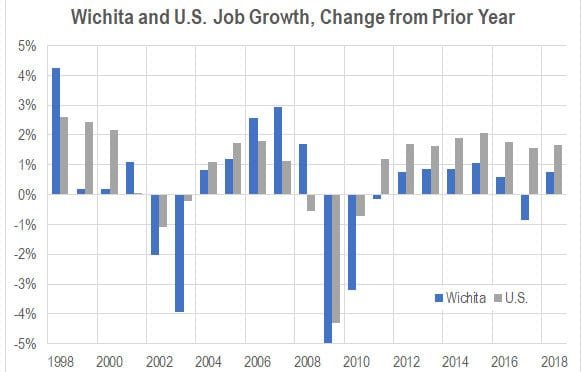
Wichita employment to grow in 2019
Jobs are forecasted to grow in Wichita in 2019, but the forecasted rate is low.
-

Wichita City Council to consider a clawback
The unrealized potential of an economic development incentive teaches lessons.
-
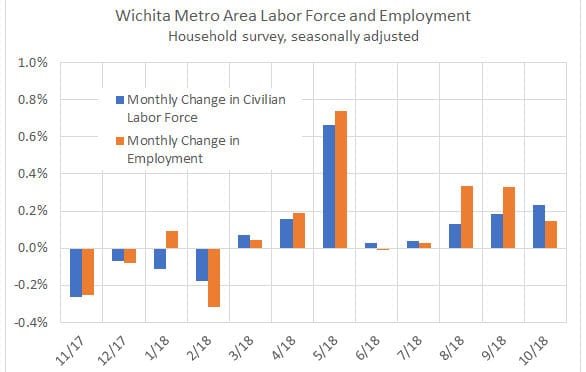
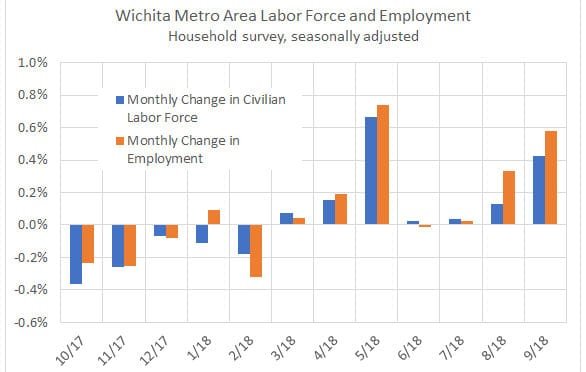
Wichita employment, November 2018
For the Wichita metropolitan area in November 2018, jobs are up, the labor force is up, and the unemployment rate is down, compared to the same month one year ago. Seasonal data shows a slowdown in the rate of job growth.
-
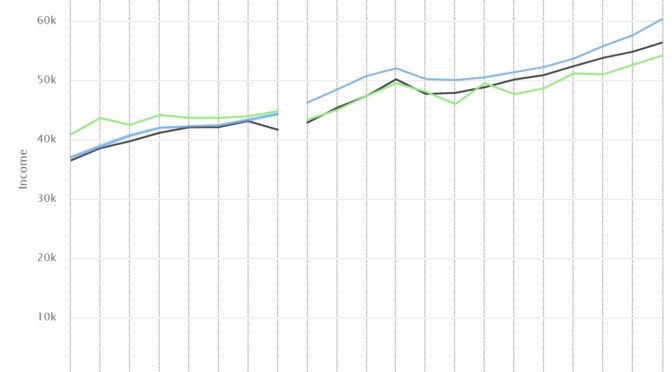
Sedgwick County income and poverty
Census data show Sedgwick County continues to fall behind the nation in two key measures.
-
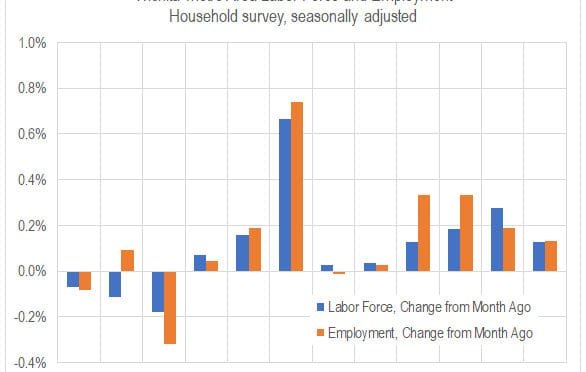
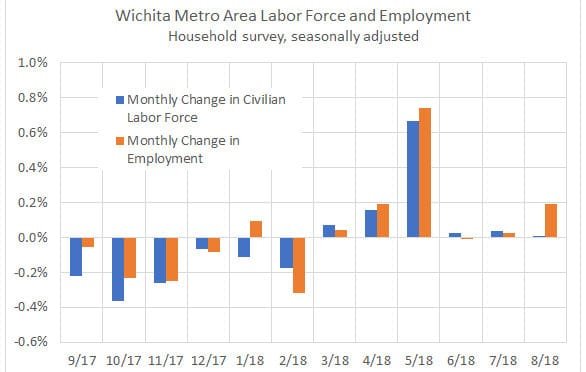
Wichita employment, October 2018
For the Wichita metropolitan area in October 2018, jobs are up, the labor force is up, and the unemployment rate is down, compared to the same month one year ago. Seasonal data shows a slowdown in the rate of job growth.
-
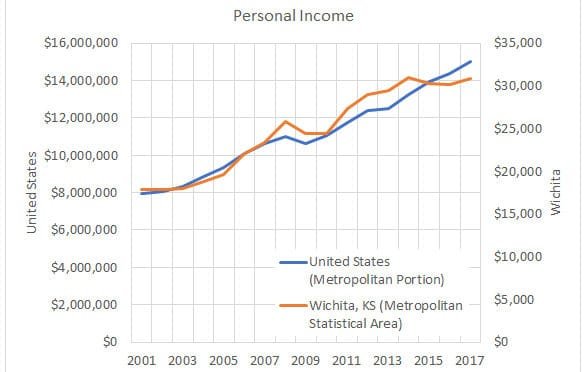
Personal income in Wichita rises, but slowly
For 2017, personal income in Wichita rose, but slower than the national rate.
-
Wichita employment, September 2018
For the Wichita metropolitan area in September 2018, jobs are up, the labor force is up, and the unemployment rate is down, compared to the same month one year ago.
-
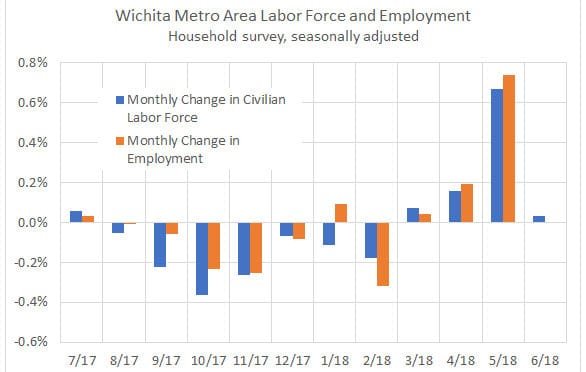
Wichita employment, August 2018
For the Wichita metropolitan area in August 2018, jobs are up, the unemployment rate is down, and the labor force is smaller, compared to the same month one year ago.
-

Wichita economy shrinks, and a revision
The Wichita economy shrank in 2017, but revised statistics show growth in 2016.
-

Wichita, not that different
We have a lot of neat stuff in Wichita. Other cities do, too.
-
Wichita employment, June 2018
For the Wichita metropolitan area in June 2018, jobs are up, the unemployment rate is down, and the labor force is smaller, compared to the same month one year ago.
-

An endorsement from the Wichita Chamber of Commerce
When the Wichita Regional Chamber of Commerce Political Action Committee endorses a candidate, consider what that means.