Tag: Greater Wichita Partnership
-

Greater Wichita Partnership
Greater Wichita Partnership features untruthful information on its website, which casts doubt on the reliability of the organization and the City of Wichita.
-
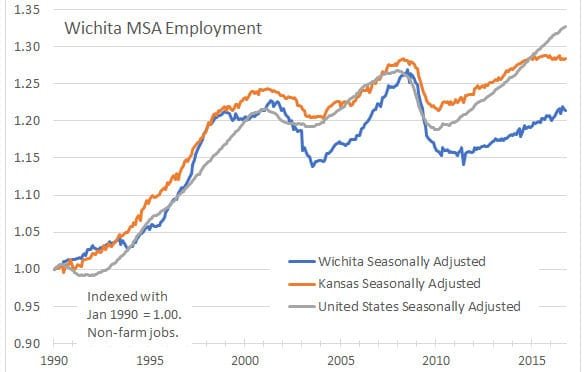
The Wichita economy, according to Milken Institute
The performance of the Wichita-area economy, compared to other large cities, is on a downward trend.
-

Regulation in Wichita, a ‘labyrinth of city processes’
Wichita offers special regulatory treatment for special circumstances, widening the gulf between the haves and have-nots.
-

WichitaLiberty.TV: Trump and the Wichita Eagle, property rights and blight, teachers union, and capitalism
Was it “Trump” or “Bernie” that incited a fight, and how does the Wichita Eagle opine? Economic development in Wichita. Blight and property rights. Teachers unions. Explaining capitalism.
-

What else can Wichita do for downtown companies?
With all Wichita has done, it may not be enough.
-
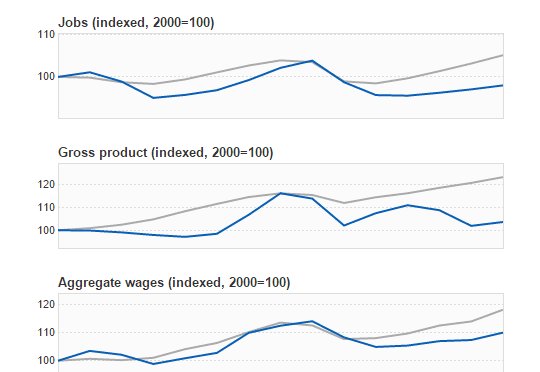
Brookings Metro Monitor and Wichita
A research project by The Brookings Institution illustrates the poor performance of the Wichita-area economy.
-

In Sedgwick County, choosing your own benchmarks
The Sedgwick County Commission makes a bid for accountability with an economic development agency, but will likely fall short of anything meaningful.