Tag: Kansas Policy Institute

  • Kansas school salaries

    Kansas school salaries

    Kansas school salaries for superintendents, principals, and teachers presented in an interactive visualization for each district, updated for 2016 data.

    Recently Kansas Policy Institute noted the discrepancy in salary increases for Kansas public school management as compared to teachers. See Pay raises to superintendents and principals far outpace those to teachers.

    In the article, David Dorsey writes: “A widely-shared solution to improving student outcomes is to put more money in the classroom. What does it say about the importance of student achievement to local school boards and administrations when pay increases are disproportionately higher to those who are not in the classroom?”

    And later: “Much has been documented about teacher shortages, especially due to those leaving after only a few years in the profession. One way to reverse that trend would be for districts to make spending choices that would support the commitment to keeping quality teachers.”

    Kansas State Department of Education has released salary figures for districts for the current school year, fiscal year 2016. Statewide, since 2008, the KSDE data shows these cumulative salary increases:

    Superintendents: 12.2 percent
    Principals: 11.8 percent
    Teachers: 8.8 percent

    If we start the comparison in 2009 the difference is larger, with increases of 8.2 percent for principals and 4.9 percent for teachers.

    It’s also useful to look at individual districts. For example, for the Wichita public school district, there are these cumulative salary increases since 2008:

    Superintendent: 53.9 percent
    Principals: 7.0 percent
    Teachers: 2.3 percent

    The Wichita district has just one superintendent, so no matter how much the salary rises, it’s still the salary for just a single person and has a negligible effect on total district payroll costs. There are, however, 89 principals, so the increase for this category of employee matters much more.

    But you have to wonder: What about the teachers?

    I’ve gathered the data and present it in an interactive visualization. You may select any single district, or use district 999 for statewide totals. Click here to open the visualization in a new window. Data is from Kansas State Department of Education. Figures include fringe benefits and are not adjusted for inflation. Visualization created using Tableau Public. There are several missing values which can make the percentage change invalid for a single year.

    Kansas school salaries. Click for larger.
    Kansas school salaries. Click for larger.
  • Wichita economic development and capacity

    Wichita economic development and capacity

    An expansion fueled by incentives is welcome, but illustrates a larger problem with Wichita-area economic development.

    Last week a Wichita company received economic development incentives in conjunction with an expansion. This is the third incentive the company has received in four years. The incentives are forgiven property taxes and sales taxes. 1 Simply, the company is allowed to skip paying many of the same taxes that everyone else must pay, including low-income households paying sales tax on groceries.

    While the expansion of this company is welcome news, the hoopla surrounding it shows how we can’t rely on government intervention to pull Wichita out of its slump. Here are some figures.

    According to the Bureau of Labor Statistics, Wichita metropolitan area employment is 14,500 less than its peak in 2008. Manufacturing jobs are down by 23,600 from the peak in 1998, or down by 15,400 from 2008. 2

    In 2012 when this company requested an incentive, its employment was given as 110. 3 Current employment is given as 130, and by 2021, the company is required to employee 188 people. 4

    So if everything goes as planned, 5 three economic development incentives programs will boost a company’s employment from 110 to 188. That’s an increase of 78 jobs over nine years, or about nine jobs per year.

    If we look at these jobs in the larger context, we see that these jobs represent 0.5 percent of the jobs lost in the Wichita area since 2008. If we are relying on these jobs to spur a renaissance of manufacturing in Wichita, they represent 0.3 percent of manufacturing jobs lost since its peak.

    This company and these three economic development incentives are not the only efforts the city has made. Other incentives to other companies have created jobs. But this company is considered a significant and major success. The awarding of this inventive was evidently such an uncommon event that it merited a large article in the Wichita Eagle. In his remarks, according to meeting minutes, Wichita Mayor Jeff Longwell said “this is how we move Wichita forward” and “this is how we grow our businesses here in Wichita and help them be successful.”

    The jobs are welcome. But this incident and many others like it reveal a capacity problem, which is this: We need to be creating nine jobs every day in order to make any significant progress in economic growth. If it takes this much effort to create 78 jobs over nine years, how much effort will it take to create the many thousands of jobs we need to create every year?

    A related problem is that we don’t know how many jobs are created by the city’s economic development efforts. As part of a campaign for a city sales tax in 2014, the city promised a web site to track the progress of jobs created. The sales tax didn’t pass, but the city still engages in economic development, and still does not track results. At least not publicly, and when I’ve asked, the results provided have been sketchy and incomplete.

    On top of this, we don’t know if the incentives were necessary to enable the company to expand. Usually city documents state that incentives are necessary to make economic activity “viable.” No such claim was made in the documents supporting this incentive.

    The large amount of bureaucratic effort and cost spent to obtain a relatively small number of jobs lets us know that we need to do something else in order to grow our local economy. We need to create a dynamic economy, focusing our efforts on creating an environment where growth can occur organically without management by government. Dr. Art Hall’s paper
    Embracing Dynamism: The Next Phase in Kansas Economic Development Policy provides much more information on the need for this.

    Another thing we can do to help organically grow our economy and jobs is to reform our local regulatory regime. Recently Kansas Policy Institute released a study of regulation and its impact at the state and local level. This is different from most investigations of regulation, as they usually focus on regulation at the federal level.

    Business Perceptions of the Economic Impact of State and Local Government Regulation coverThe study is titled “Business Perceptions of the Economic Impact of State and Local Government Regulation.” It was conducted by the Hugo Wall School of Public Affairs at Wichita State University. Click here to view the entire document.

    Our civic leaders say that our economic development efforts must be reformed. Will the path forward be a dynamic economy and reformed regulation? Or will it be more bureaucracy, handfuls of jobs at a time?


    Notes

    1. Wichita City Council meeting agenda, April 5, 2016, p. 12.
    2. According to the Bureau of Labor Statistics, the peak of nonfarm employment in the Wichita metropolitan area was in 2008, where employment averaged 310,500. For 2015, employment averaged 296,000. That’s a loss of 14,500 jobs. For manufacturing jobs, the peak was 1998, when employment in this field was 75,900. In 2008 the figure was 67,700 jobs, and in 2015, 52,300 jobs. This is a loss of 23,600 jobs from manufacturing’s peak, or of 15,400 jobs from Wichita peak employment in 2008.
    3. Wichita City Council meeting agenda, September 11, 2012, p. 45
    4. Wichita City Council meeting agenda, April 5, 2016, p. 12.
    5. So far, employment is not progressing as planned. In the 2012 agenda item, it was said that employment would rise by 50 jobs over the next five years, which you by 2017. Current employment, according to the current city council agenda, is 130, which is 30 jobs short. The deadline for this projection has not yet arrived.
  • At Pachyderm: Kansas Legislature education chairs to speak

    At Pachyderm: Kansas Legislature education chairs to speak

    This week (April 15, 2016) the Wichita Pachyderm Club features Kansas Representative Ron Highland (Chair, House Education Committee) and Kansas Senator Steve Abrams (Chair, Senate Education Committee). Their topic is “A report from the House and Senate Education Chairmen on the 2016 Legislative Session.”

    A new school finance bill has been introduced. Undoubtedly it will be a major topic. Background on this bill is here:

    Kansas Legislature: HB 2741, Creating the school district finance and student success act. Contains the text of the bill.

    Wichita Eagle: New proposal for Kansas school finance formula sparks worries

    Kansas Policy Institute: Kansas Legislature Introduces Transformative New School Funding System.

    Kansas Association of School Boards: Summary of HB 2741.

    The Wichita Pachyderm Club is a friendly club. Everyone is welcome to attend meetings. The meeting cost, which includes a delicious buffet lunch plus coffee and/or iced tea, is $15 ($12 for Pachyderm Club members). This event is held in the Wichita Petroleum Club, located on the top floor of the Ruffin Building at 100 N. Broadway. You may park in the garage on Broadway, and if you do, bring your parking ticket to have it stamped for $1.00 parking.

  • Math quiz on Kansas spending

    Math quiz on Kansas spending

    The average Kansan is misinformed regarding Kansas school spending, and Kansas news media are to blame, writes Paul Waggoner of Hutchinson.

    Math Quiz on Kansas Spending

    By Paul Waggoner

    Math questions, one would think, are very straight-forward and easy to answer. At least easy to guess the right answer in a simple multiple choice test. Such is not the case however with the average Kansan who follows state issues relying on the headlines in the Kansas press.

    The reality of how poor a job the Kansas press is doing with numbers is found in a December 2015 SurveyUSA study of 500 plus registered voters in Kansas. This scientific study of voters’ knowledge of educational spending in Kansas was virtually ignored by the Kansas media. Most likely because its implications don’t fit the media narrative on education in this Year 5 of the Age of Brownback. Even worse, the poll was commissioned by a conservative think tank, the Kansas Policy Institute.

    As to voter (mis) understanding this 15 question poll hit the jackpot. All the questions were multiple choice with only 4 options given.

    Question #6 asked how much state funding do you think Kansas school districts receive per pupil? The correct answer is well over $7,000 per student. 39% of Kansas voters thought it was under $4,000, another 22% thought between $4,000 and $5,000. Only 7% of voters guessed properly.

    The follow-up, Question #7, was how much total (federal/state/local) funding do you think Kansas school districts receive per pupil? The correct answer in 2015 was over $13,000 per pupil. Only 5% of registered Kansas voters got that one right. 40% thought the total was under $7,000, and 21% said $7,000 to $10,000 which were the two most inaccurate options!

    At this point I was even wondering how the accepted wisdom is so far removed from the truth. So I went to ksde.org, the website of the Kansas State Department of Education, to verify the precise figures. At that website every school district in the state is listed.

    What our local school districts spend is very close to the state averages. The Hutchinson USD 308 budget was over $60,000,000 in 2014 with 4,836 full-time students or $12,449 spent per pupil. 5 years earlier the USD 308 budget was $57 million, 5 years before that it was about $41 million.

    The comparable figures for USD 313 Buhler are $12,360 per pupil in 2014 with a $26,300,000 budget that 5 years earlier was $22,200,00 and 5 years before that was $18,000,000. For USD 313 that meant students were educated for just $9,000 per pupil as recently as 2005.

    Kansas school districts total spending is $2.0 billion higher now than just 10 years ago ($6 billion versus $4 billion). That is an incontrovertible fact. Which leads to two immediate questions: How can the Supreme court keep claiming the spending is constitutionally inadequate? And what exactly do taxpayers have to show for the extra $2,000,000,000 every year?

    The reality of those numbers are nowhere in the publics’ consciousness currently. For instance, SurveyUSA question #8 was “over the last 5 years how much do you think total per pupil funding has changed?” The correct answer is that it is actually up 9.92%. But fully 47% of Kansas voters confidently said it had dropped over 5%! Another 15% were sure it had dropped but thought the percentage was smaller. Only 7% of voters knew that school spending was up “over 5%’.

    The budget trajectory has changed and is on a much flatter curve than ever before. Taxpayers are mostly rejoicing, tax spenders (and their allies) are howling mad.

    My revised school spending narrative is frankly the story of the entire Kansas budget (as can be easily accessed at budget.ks.gov “Governors Budget Report FY 2017”).

    The state general fund budget first hit $1 billion in 1980 and grew consistently under Governors Carlin/Hayden/Finney at about a 6.5% annual rate.

    Under Graves and Sebelius that accelerated growth rate continued until the 2008-09 recession when the state budget dropped dramatically for 1 year under Governor Parkinson. This made a cumulative annual growth average of around 3% for those three administrations.

    Under Governor Brownback the general fund budget is still going up, but at a 5 year annual growth rate of 1.8%.

    On February 20th one Hutchinson News columnist’s headline blasted the “Deliberate financial starving of the state of Kansas.” I see this as more of a diet, and I say it is about time.

    The numbers on the state budget spending (and taxation) are readily available online. The execution of the plan for this new governmental trajectory leave something to be desired, but that is the topic for another day.

    Paul Waggoner is a Hutchinson resident and business owner. He can be reached with comments or questions at waggonerpm@gmail.com.

  • Kansas school salaries

    Kansas school salaries

    Kansas school salaries for superintendents, principals, and teachers presented in an interactive visualization for each district.

    Recently Kansas Policy Institute noted the discrepancy in salary increases for Kansas public school management as compared to teachers. See Pay raises to superintendents and principals far outpace those to teachers.

    In the article, David Dorsey writes: “A widely-shared solution to improving student outcomes is to put more money in the classroom. What does it say about the importance of student achievement to local school boards and administrations when pay increases are disproportionately higher to those who are not in the classroom?”

    And later: “Much has been documented about teacher shortages, especially due to those leaving after only a few years in the profession. One way to reverse that trend would be for districts to make spending choices that would support the commitment to keeping quality teachers.”

    Statewide, since 2009, KSDE data shows these cumulative salary increases:

    Superintendents: 7.9 percent
    Principals: 7.4 percent
    Teachers: 3.9 percent

    It’s also useful to look at individual districts. For example, for the Wichita public school district, there are these cumulative salary increases since 2009:

    Superintendent: 39.9 percent
    Principals: 4.7 percent
    Teachers: -0.8 percent, a decline

    The Wichita district has just one superintendent, so no matter how much the salary rises, it’s still the salary for just a single person and has a negligible effect on total district payroll costs. There are, however, 89 principals, so the increase for this category of employee matters much more.

    But you have to wonder: What about the teachers?

    I’ve gathered the data and present it in an interactive visualization. You may select any single district, or use district 999 for statewide totals. Click here to open the visualization in a new window. Data is from Kansas State Department of Education. Figures include fringe benefits. Visualization created using Tableau Public. There are several missing values which can make the percentage increase invalid for a single year.

    Kansas school salaries and change, statewide, through 2015. Click for larger version.
    Kansas school salaries and change, statewide, through 2015. Click for larger version.
  • Kansas school districts compliance with transparency law

    Kansas school districts compliance with transparency law

    Some Kansas school districts are not complying with basic transparency, even though there is a law, finds Kansas Policy Institute.

    School districts still not complying with transparency law

    By Dave Trabert, Kansas Policy Institute

    The Kansas Uniform Financial Accounting and Reporting Act — K.S.A. 72-8254 passed in 2013 requires every school district to publish specific budget information for the current school year and actual expenditures for the immediately preceding two school years, and stipulates that the report “shall be published with an easily identifiable link located on such district’s website homepage.” Unfortunately, some districts still fail to comply with this very simple transparency requirement.

    This table shows the results of a random sample of 40 districts’ web sites. The five districts in column 1 were found to be in compliance; the required report appears by title on the home page and the link goes directly to the report. Column 2 lists twenty-three districts that don’t link the report as required but do provide a generic link (e.g., “Budget Information”) that goes to a page where the report can be accessed with another link. The twelve districts in column 3 have nothing visible on their home

    This ongoing problem was brought to the attention of legislators and the Department of Education several times in 2014, and last year Senate Bill 188 was introduced to add a consequence for non-compliance; if not in compliance within 30 days of written notice, districts would be fined $1,000 per day until doing so. The bill passed the Senate by a vote of 27-13 and was carried over to the House this year where it should be scheduled for a vote.

    Democrats and Republicans alike are calling for increased transparency this year. It will be interesting to see how many are willing to hold school districts accountable to existing transparency law.

  • Survey finds Kansans with little knowledge of school spending

    Survey finds Kansans with little knowledge of school spending

    As in years past, a survey finds that when Kansans are asked questions about the level of school spending, few have the correct information. From Kansas Policy Institute.

    Survey Finds Kansans Misled on School Spending

    December 14, 2015 — Wichita — Kansas Policy Institute released a new Survey USA Poll of 509 registered voters in Kansas showing a significant disconnect between voters’ perception of Kansas school spending and true expenditures.

    The survey found 47% of Kansans believe per-pupil funding has dropped more than 5% in the last 5 years. Another 15% believe it has dropped less than 5%. In fact, school funding has increased by 6.4%. Only 7% of those surveyed believe there have been such increases.

    “The narrative coming out of school districts is intentionally misleading,” said Kansas Policy Institute President Dave Trabert. “District officials aided by their government funded lobbyists are telling parents and students that because they didn’t receive increases as big as they want, they are being ‘cut’. This is patently false.”

    Citizens have also been misled about actual funding amounts. The survey found 61% of Kansans believe per-pupil funding from the state is less than $5,000 when in reality, it was $8,567 last year; 61% also believe total funding is less than $10,000, while actual funding was $13,124 per pupil. Less than 10% of Kansans identified true funding levels. “Knowing the extent to which school districts have misled Kansans, it’s no wonder that so many are upset about school funding,” said KPI President Dave Trabert.

    However, when voters are faced with the factual data of per pupil spending and cash reserve balances, a majority reject the idea of paying more taxes to fund schools, 50% somewhat or strongly disagree to 41% somewhat or strongly agree.

    “Every Kansan wants to do what is best for their child’s education. Unfortunately, too many Kansans haven’t been trusted with the complete truth and won’t have the opportunity to make sure their children are in the best possible situation to succeed,” said KPI Vice President and Policy Director James Franko.

    The survey also found that 66% agree, somewhat or strongly, that spending on out-of-the-classroom expenses should be provided on a more efficient, regional basis to divert savings back into classroom spending. only 21% are somewhat or strongly opposed.Support for this common-sense concept extends across all geographic and ideological boundaries, yet local school boards remain fiercely opposed.

    “Kansans need to know the truth about record-setting school funding”, said Dave Trabert. “Only through an informed citizenry can we create sound economic policy and improve education outcomes for our students.”

    The survey was of 509 registered voters with a 4.4% margin of error. Full results of the survey can be viewed here.

  • CBPP pushes political viewpoint as economic analysis

    CBPP pushes political viewpoint as economic analysis

    The Center on Budget & Policy Priorities (CBPP) is at it again, pushing their political viewpoint disguised as economic analysis, writes Dave Trabert of Kansas Policy Institute.
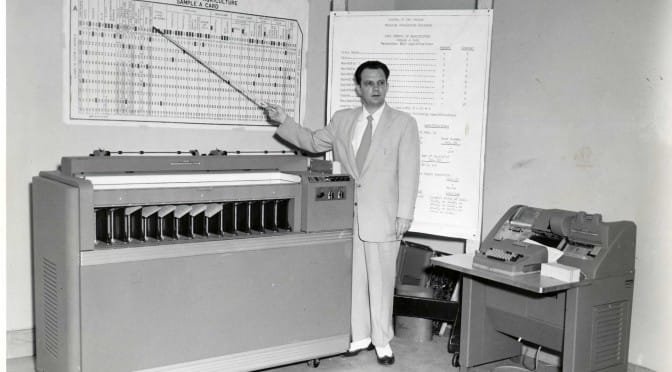
    CBPP pushes political viewpoint as economic analysis

    By Dave Trabert, Kansas Policy Institute

    Well, the Center on Budget & Policy Priorities (CBPP) is at it again … pushing their political viewpoint disguised as economic analysis. CBPP’s November 30 blog post attempts to use Gross Domestic Product (GDP) data to warn other states that Kansas’ tax reform is failing.

    CBPP’s simplistic look at annual changes in GDP seems merely designed to support their political preference for higher taxes and spending, as a look at the underlying data throws a lot of cold water on their contention.

    First of all, CBPP is talking about total real GDP, which includes government and is adjusted for inflation. The intent of tax reform was to grow the private sector, not government, so an honest analysis would at least show the difference. The CBPP chart shows 2013 growth at -0.3% for Kansas and 1.9% for the nation; Kansas also trailed (1.8% to 2.2%) in 2014. The adjacent table shows private sector growth is closer to the national average, but that is just the beginning.

    Tax policy certainly has an impact on economic growth but some change is unrelated to tax policy. For example, Kansas is much more reliant on aerospace that most states and changes in that industry are driven by global demand more than anything else. The Kansas economy is also more reliant on oil and gas than most states, so declining oil prices have disproportionate economic impact on extraction and refining.

    Each of those three areas declined in 2013 (aerospace is a sub-sector of Other Transportation Equipment Manufacturing) in Kansas but they increased in the nation as a whole. But Kansas outperformed the nation on everything else (97% of the U.S. economy, 95.4% in Kansas), growing 2.5% to the nation’s 2.2%.

    That’s not to say that tax reform is a success — it’s far too early to judge — but it does show that factors other than tax reform had a very significant negative impact in 2013.

    Let’s now look at 2014. BEA has not yet published sub-sector data for 2014 but we can look at the sectors that include them. Mining (oil & gas extracting) increased in Kansas and the nation, but much less so in Kansas. Non-Durable Goods (petroleum manufacturing) did slightly better in Kansas than across the nation but Durable Goods (aerospace) declined in Kansas while the nation as a whole increased. But once again, everything else grew faster in Kansas (2.5%) than the nation overall (2.3%).

    We won’t know for certain until the sub-sector data is published, but there is a reasonable possibility that, aside from those three relatively small sub-sectors, Kansas again outperformed the rest of the nation in private sector GDP.

    This is really easy information to find if one bothers to look, but CBPP apparently isn’t interested in real economic analysis; they distort data to support their political perspective as we have shown here and here.

    The 2015 projection comes from Kansas Legislative Research and appears to include government rather than just reflect the private sector. Their underlying rationale has been requested and will be addressed here once they provide the data.

  • Kansas at-risk school funding report released

    Kansas at-risk school funding report released

    KPI releases landmark at-risk education report

    By David Dorsey, Kansas Policy Institute

    The Kansas at-risk program, which spent $3.6 billion over the past 23 years, failed its mission to improve the performance of the very students it was designed to serve. Achievement gaps in academic performance (in this case the difference between low-income and not-low-income students) are universal, significant and persistent despite the incredible growth in funding, in particular the increases since 2005.

    From Kansas Policy Institute: "At-risk funding: Increased funding failed to increase achievement"
    From Kansas Policy Institute: “At-risk funding: Increased funding failed to increase achievement”
    That and other findings and recommendations are in Kansas Policy Institute’s just released research report At-Risk Funding: Increased Money Fails to Increase Achievement.

    Four basic reasons the program failed in its mission are: dollars were not targeted exclusively to at-risk students, some funds were actually targeted directly to non-at-risk students, school districts were not held accountable, and scant information about the at-risk program was made available to the legislature and the public.

    Despite the shortcomings, an at-risk component should be included in the new education finance law, with these fundamental changes: at-risk students must be clearly identified and dollars targeted directly to them, the method of funding the program should be changed, and school districts must be held accountable to the public.

    It is important to note that there is no recommendation for reducing the amount of funding for at-risk students, but a call for a more effective use of the dollars.

    Eric Hanushek, Senior Fellow at the Hoover Institution of Stanford University and education policy authority, made these concurring remarks:

    This report on at-risk funding in Kansas accurately identifies what is a national problem.  While we directly fund a number of programs to improve the education of at-risk students, we never follow-up to see that the money is used effectively.  If we are going to solve this problem of achievement gaps, we need to fund programs to support at-risk students but to hold schools accountable for results.

    As the Kansas legislature crafts a new K-12 finance law, it is the perfect opportunity to overhaul the approach in addressing inequities in achievement based on economic status. It’s time to put all Kansas students first.