Tag: Kansas State Department of Education
-

National Assessment of Educational Progress (NAEP) for Kansas
Looking at Kansas school test scores as compared to the nation.
-
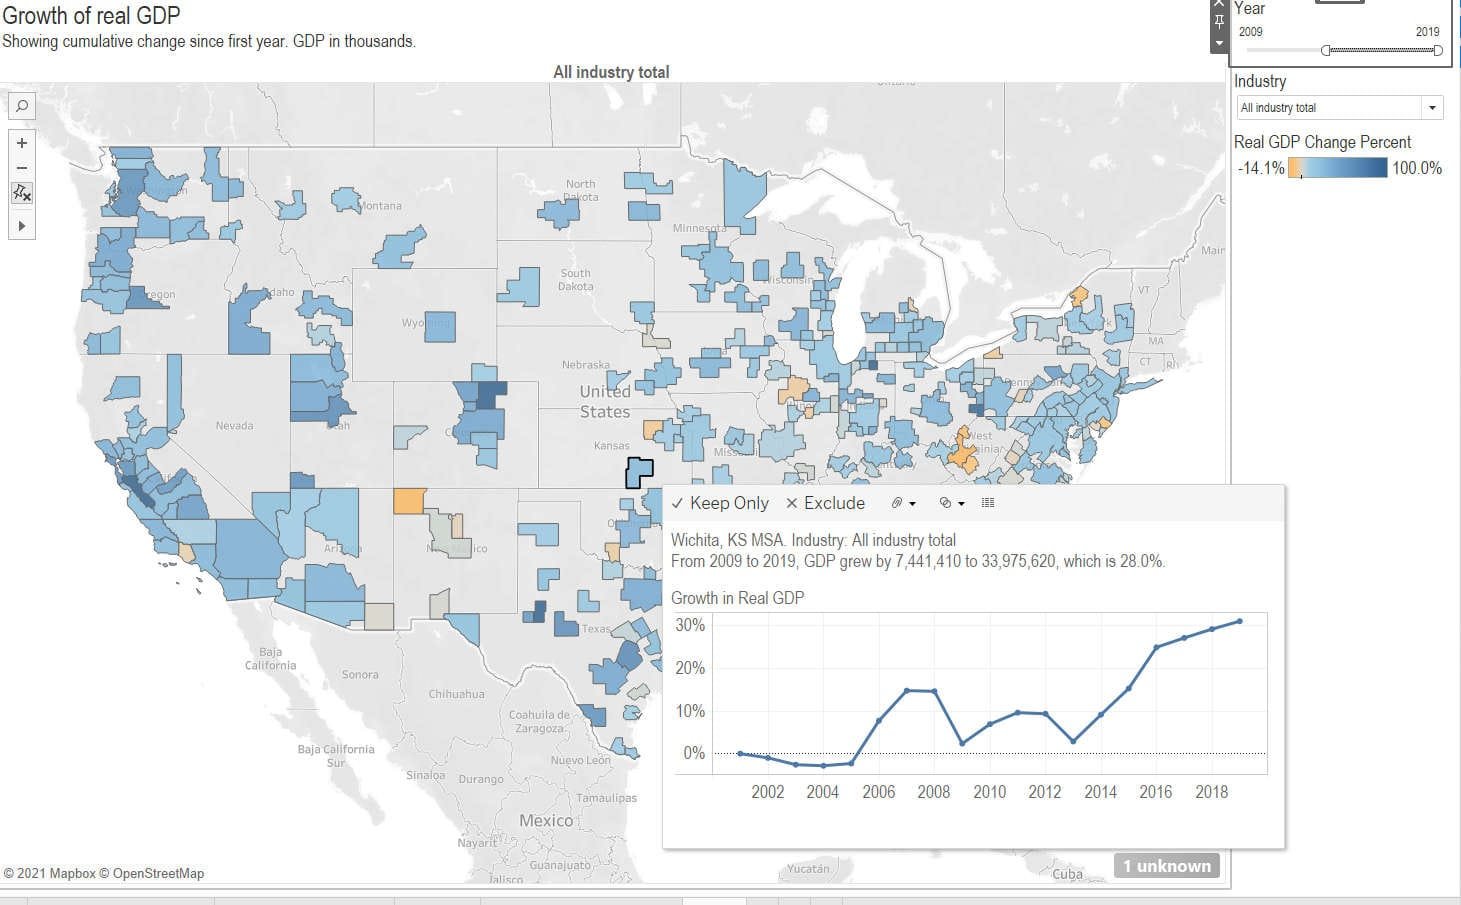
GDP by metropolitan area and component
An interactive visualization of gross domestic product by metropolitan area and industry.
-
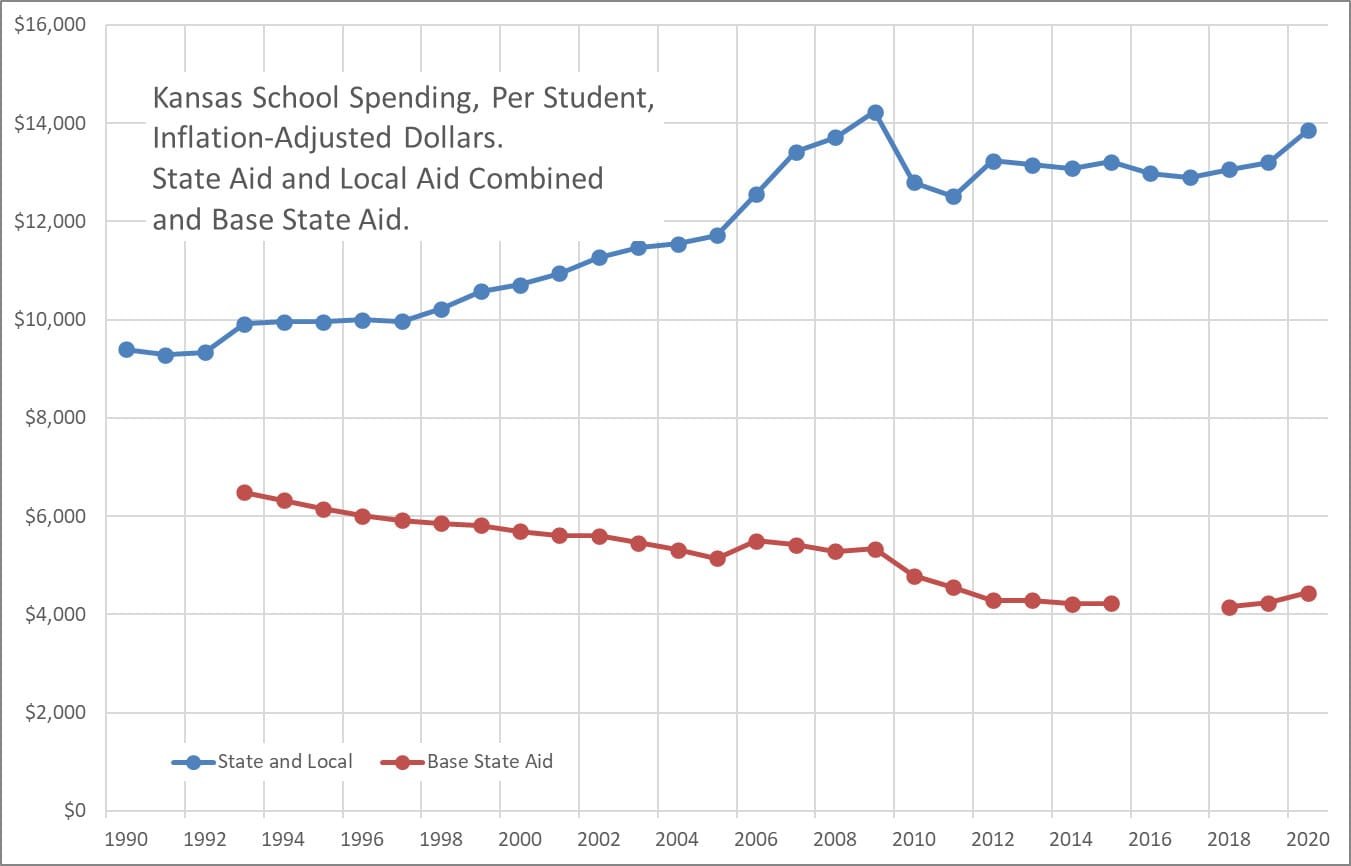
Kansas school spending, through 2020
Charts of Kansas school spending presented in different forms.
-

Kansas school employment
Kansas school employment rose for the current school year.
-

Kansas school salaries
Kansas school salaries, visualized.
-

Wichita public schools, by the charts
Data from the annual report for the 2018-2019 school year for USD 259, the Wichita, Kansas public school district.
-

In NAEP mapping study, Kansas shines
In a new edition of a study that assesses the stringency of state school assessments, Kansas performs well.
-

Wichita public schools, by the charts
Data from the annual report for USD 259, the Wichita, Kansas, public school district.
-

Kansas tax credit scholarship program
An op-ed in the Wichita Eagle regarding school choice prompts uninformed and misinformed comments.
-
Kansas school salaries
An interactive visualization of Kansas school salaries by district and category.
-

Kansas school spending, through 2018
Charts of Kansas school spending presented in different forms.
-

Wichita school spending, according to the Wichita Eagle
A recent editorial by the largest newspaper in Kansas misinforms its readers.