Tag: Kansas State Department of Education
-
Topeka school figures
The Topeka school district is asking voters for more tax revenue. Here are some figures for this school district.
-
Kansas City school district figures
The Kansas City, Kansas school district has implemented layoffs and salary cuts. Here are some charts of statistics for this district.
-
In Topeka, to raise taxes, scare the voters
The Topeka public school district is using scare tactics to persuade voters to raise taxes. David Dorsey of Kansas Policy Institute explains.
-
Kansas school weightings and effects on state aid
In making the case for more Kansas school spending, the focus on base state aid per pupil leaves out important considerations.
-
Kansas state aid to schools is increasing
The top school finance official in Kansas says that says that state aid for schools has risen for the current year.
-
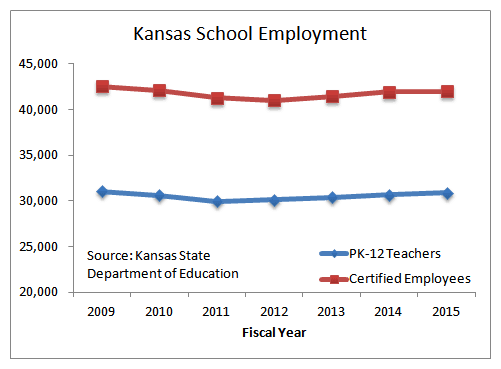
Kansas school employees, the trend
The trend in Kansas public school employment and teacher/pupil ratios may surprise you, given the narrative presented by public schools.
-
Kansas school test scores, an untold story
If the Kansas public school establishment wants to present an accurate assessment of Kansas schools, it should start with its presentation of NAEP scores.
-
Kansas Center for Economic Growth: Short on facts again
The Kansas Center for Economic Growth’s latest scare tactic on education funding is filled with demonstrably inaccurate data which they use to make false claims about tax reform and the efficacy of education spending, writes David Dorsey of Kansas Policy Institute.
-
School employment data shows gaps in reporting and wide variations among districts
Kansas school districts vary widely in employment ratios, and that’s not counting the unreported employees, writes David Dorsey of Kansas Policy Institute.
-
Kansas school funding still sets new record with block grant proposal
Kansas school funding is at a record high this year and is projected to rise next year, writes Dave Trabert of Kansas Policy Institute.
-
Better outcomes at a better price in Johnson County
If the other five Johnson County districts operated at the per-pupil cost of De Soto, the burden on taxpayers could be reduced by $127.1 million, writes Dave Trabert of Kansas Policy Institute.
-
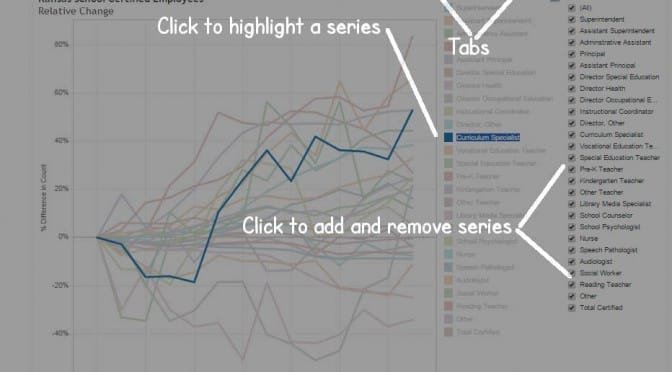
Kansas school employees by type
An interactive visualization of trends in Kansas school employment.