Tag: Politics
-
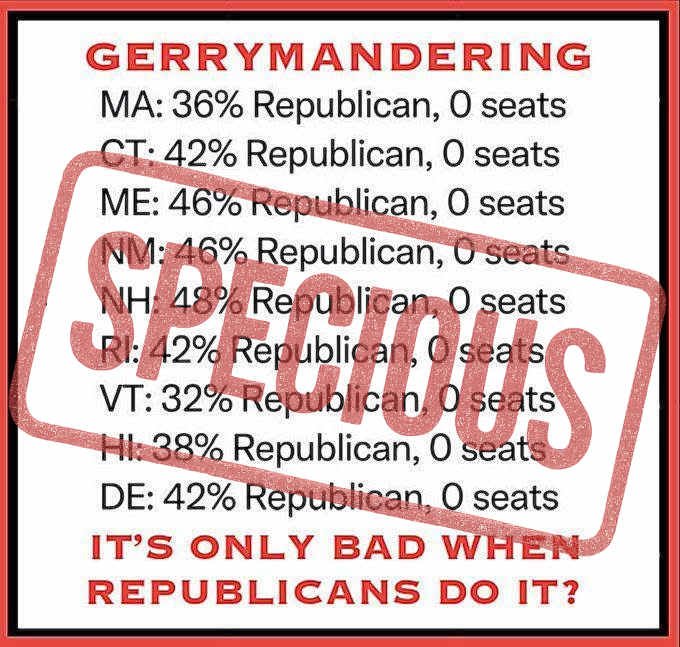
Misleading on Gerrymandering
The meme simplifies a complex issue by equating disproportional outcomes with gerrymandering and by ignoring structural and geographic factors that explain seat distribution.
-
Motivated Numeracy and Enlightened Self-Government
This 2017 paper by Dan Kahan and colleagues from Yale, Ohio State, Cornell, and University of Oregon presents groundbreaking research on why political polarization over scientific evidence persists despite widespread access to compelling data
-

Cost of Voting in States
There’s a clear relationship between how a state voted in 2024 and how difficult that state makes it for people to vote.
-
White House: BLS Has Lengthy History of Inaccuracies, Incompetence
This White House article presents a highly critical assessment of the Bureau of Labor Statistics under the previous administration. It accurately identifies notable BLS revisions, a significant benchmark adjustment, and procedural lapses in August 2024. However, its framing of these events as evidence of systemic incompetence does not fully account for the agency’s established revision…
-

Gross Domestic Product per Person in States
This scatter plot reveals a fascinating relationship between political preferences and economic prosperity across US states.
-

Gross Domestic Product in Counties
This scatter plot reveals a fascinating relationship between economic output and voting patterns at the county level in the United States.
-
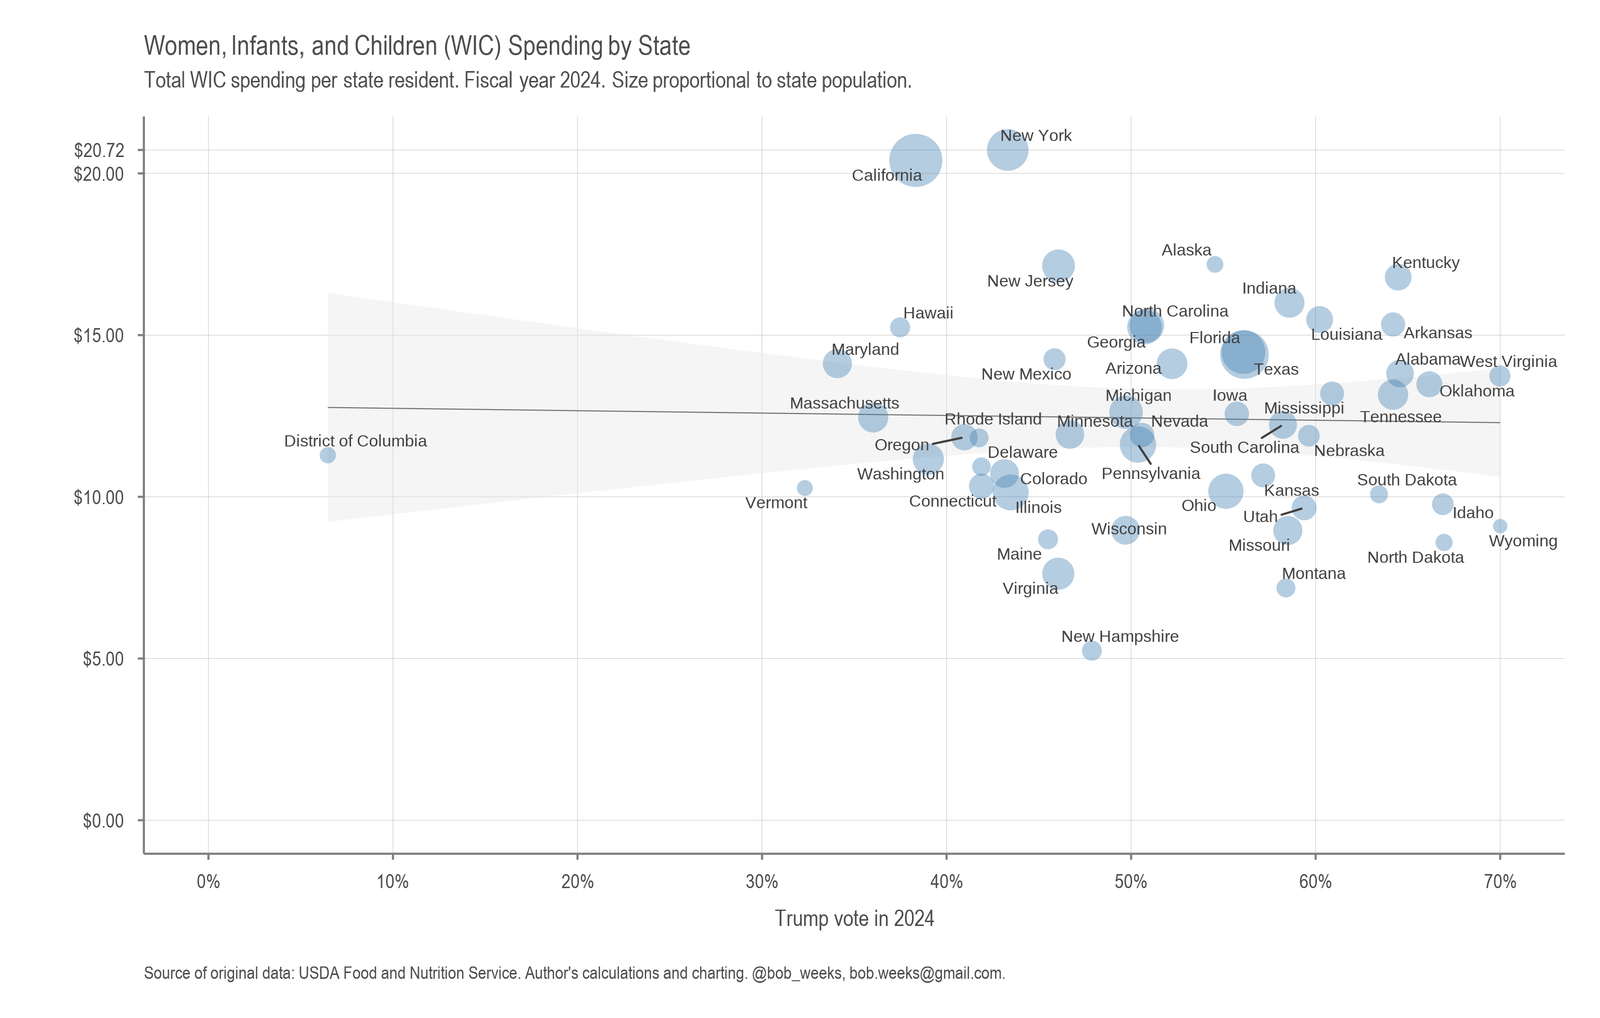
Women, Infants, and Children (WIC) Spending by State
Participation and spending on WIC by state political sentiment.
-
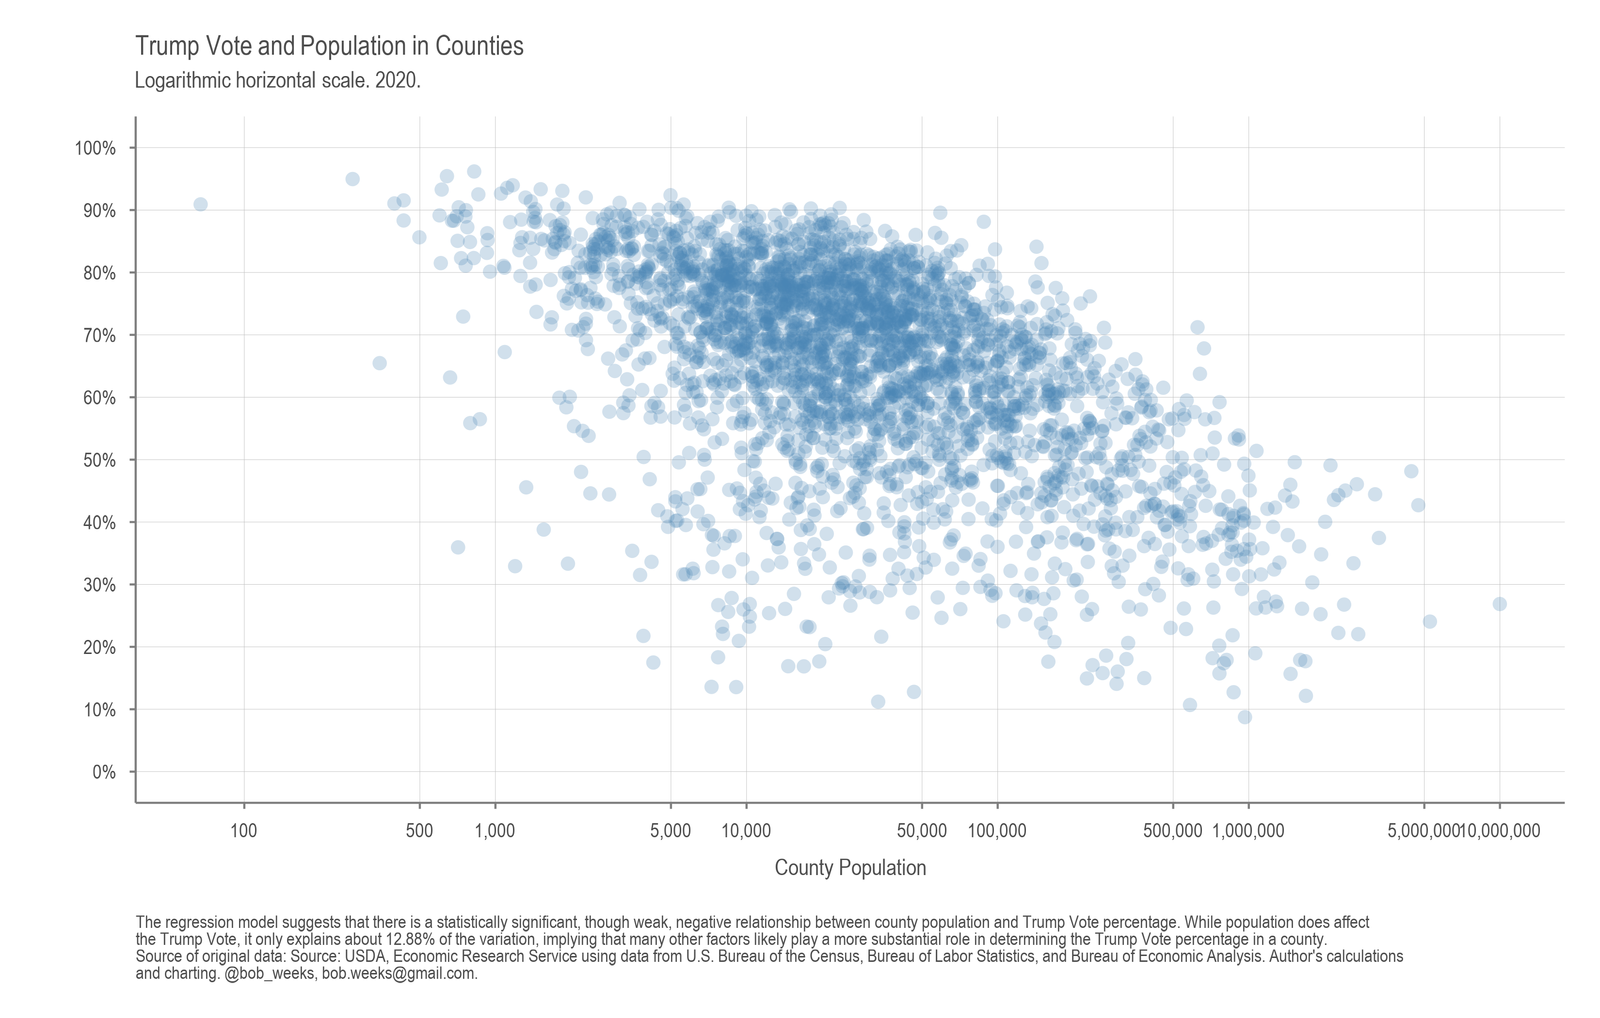
Voting and Registration in States and Counties
Charts of voting and registration in states and counties.
-
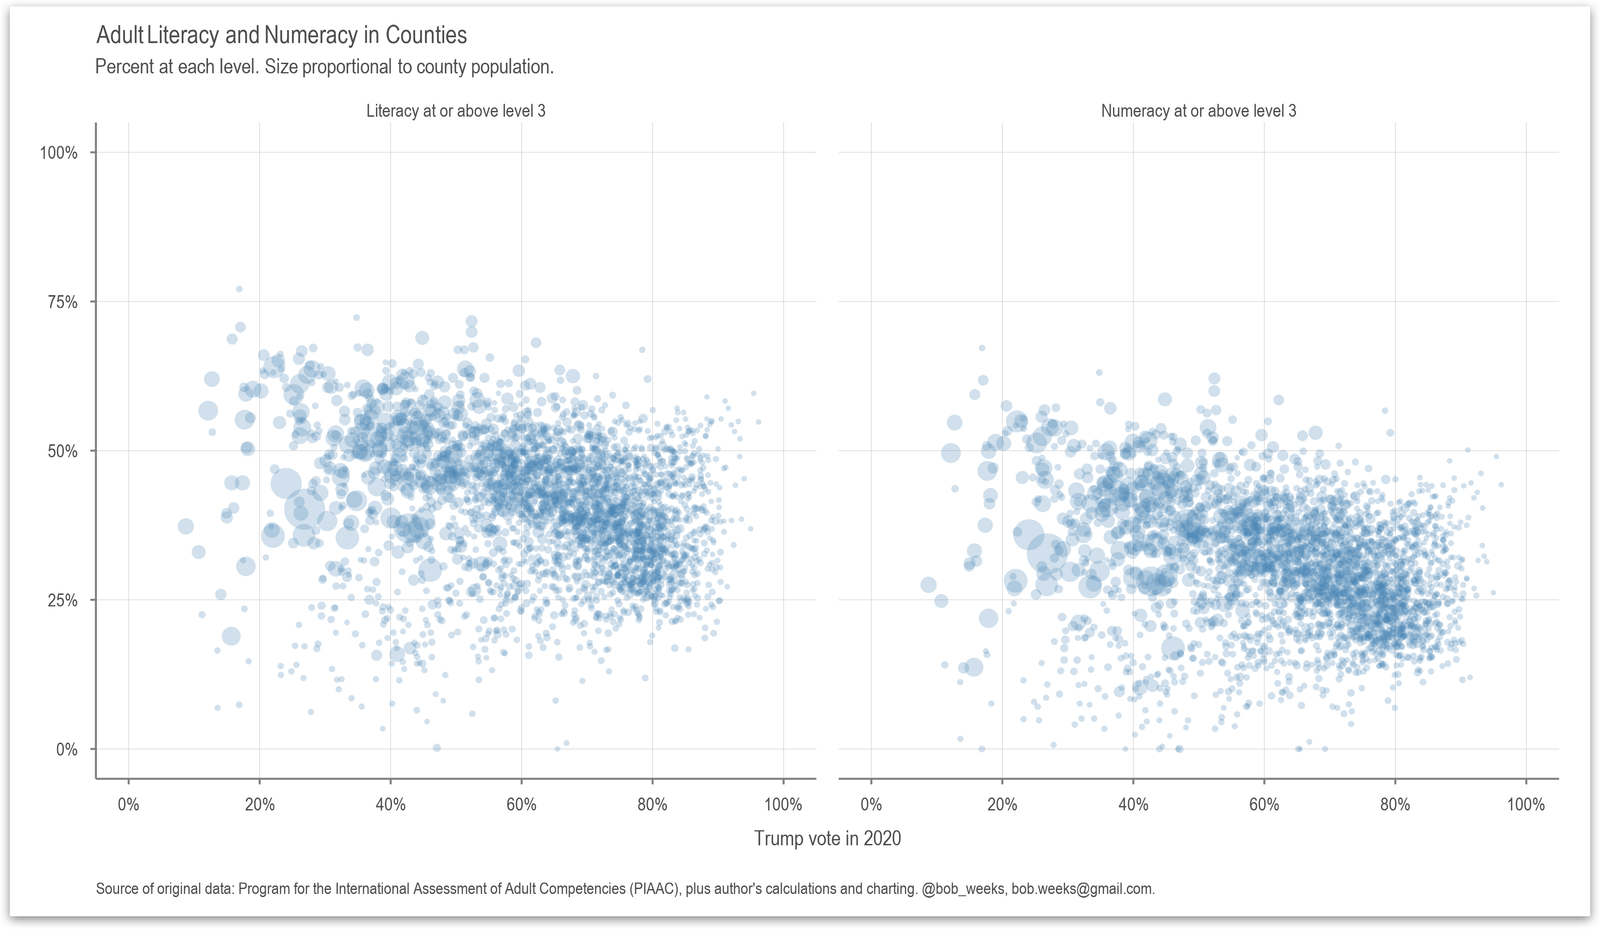
Adult Literacy and Numeracy in Counties
Examining literacy and numeracy based on political preference.
-
Republicans Will Encourage Voting Before Election Day
This article, written by Walter Olson and published on Cato Institute, discusses a significant shift in the Republican Party’s stance on voting methods. Former President Donald Trump, who once criticized alternate voting methods as prone to fraud and urged Republicans to vote on Election Day, and the GOP are now encouraging the use of various…
-

The Polity Project
The United States slipped towards dangerous anocracy, but has improved.