Tag: Sedgwick county government
-
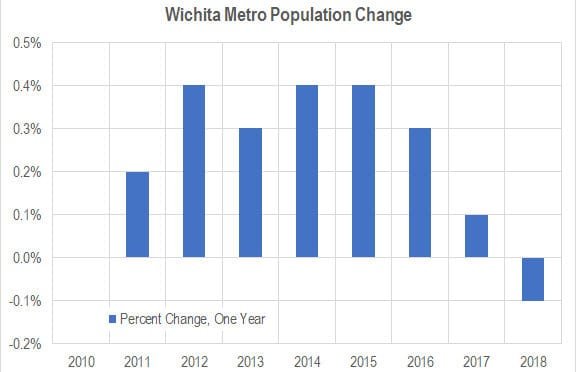
Wichita population falls; outmigration continues
The population of the Wichita MSA fell from 2017 to 2018, and net domestic migration continues at a high level.
-
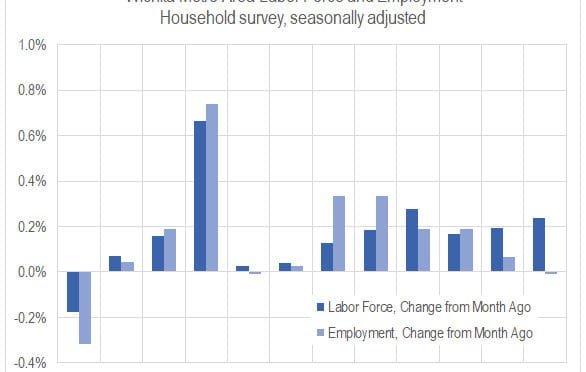
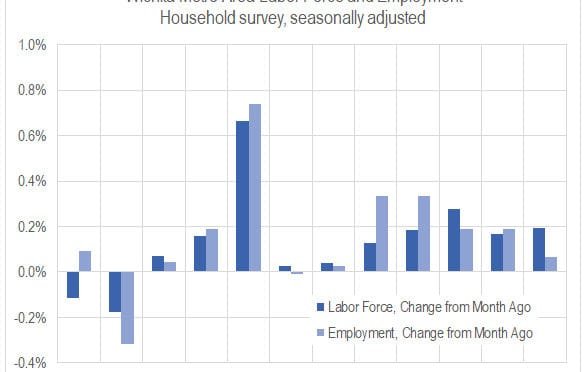
Wichita jobs and employment, February 2019
For the Wichita metropolitan area in February 2019, jobs are up, the labor force is up, and the unemployment rate is down when compared to the same month one year ago. Seasonal data shows a return to job growth.
-
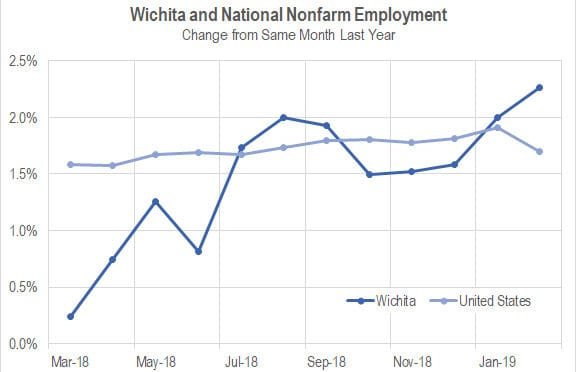
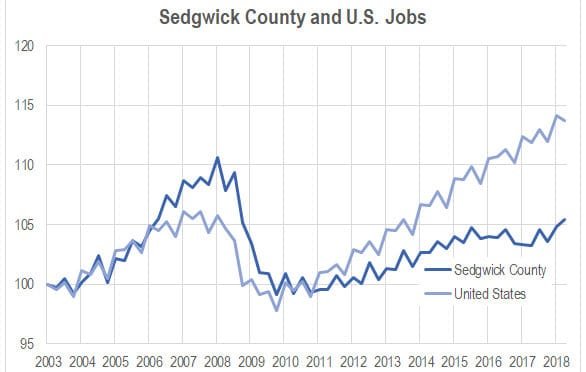
Wichita and national jobs
Growth of employment in Wichita compared to the nation.
-
Wichita jobs and employment, January 2019
For the Wichita metropolitan area in January 2019, jobs are up, the labor force is up, and the unemployment rate is unchanged when compared to the same month one year ago. Seasonal data shows a slowdown in the rate of job growth and a rising unemployment rate.
-
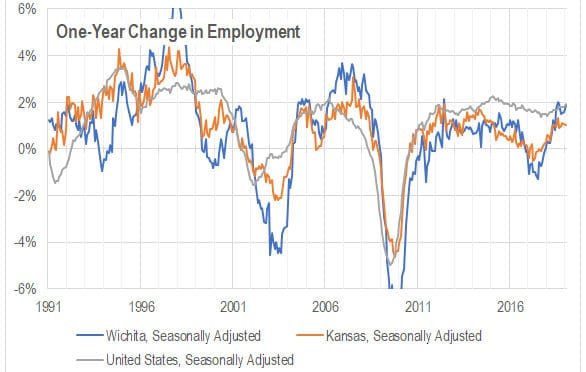
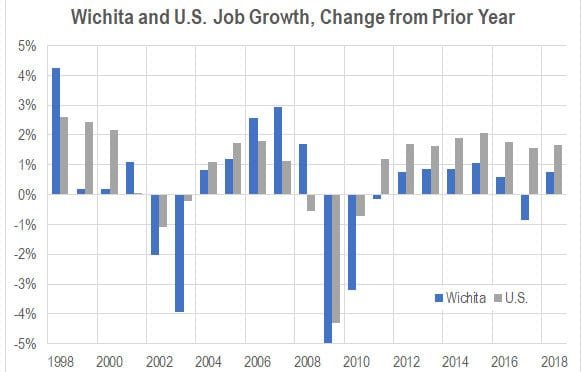
Sedgwick County job growth exceeds national rate
In the third quarter of 2018, Sedgwick County quarterly job growth exceeded the national rate for the first time in nearly ten years.
-

Sedgwick County Commission needs to slow down, get things right
Sedgwick County needs to make sure past issues are known and settled before proceeding with hiring a new county manager, writes former commissioner Richard Ranzau.
-
Wichita jobs and employment, December 2018
For the Wichita metropolitan area in December 2018, jobs are up, the labor force is up, and the unemployment rate is down when compared to the same month one year ago. Seasonal data shows a slowdown in the rate of job growth and a rising unemployment rate.
-
Retiring Sedgwick County Commissioner Dave Unruh praised
The praise for retired Sedgwick County Commissioner Dave Unruh can’t be based on our region’s accomplishments under his guidance. That is, if people are informed and truthful.
-

Wichita migration not improving
Data from the United States Census Bureau shows that the Wichita metropolitan area has lost many people to domestic migration, and the situation is not improving.
-
Wichita employment to grow in 2019
Jobs are forecasted to grow in Wichita in 2019, but the forecasted rate is low.
-

Unruh recollections disputed
A former Sedgwick County Commissioner disputes the narrative told by a retiring commissioner.
-
Taxpayers will miss Richard Ranzau
When a county commissioner’s questions produce a reversal of the county manager’s spending plans, you know we have good representation.