Tag: Taxation
-
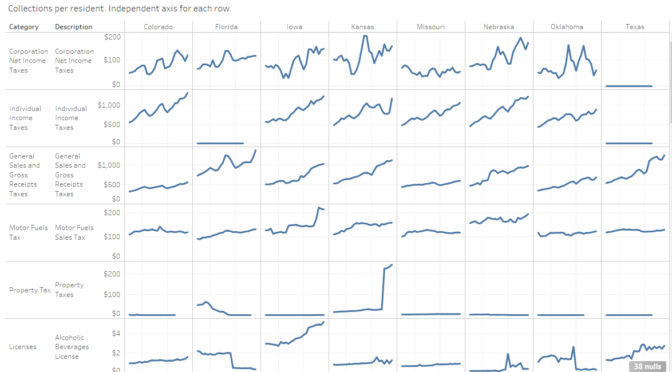
Updated: State government tax collections
Kansas personal income tax collections rose by $372 per person in 2018, an increase of 46.5 percent.
-
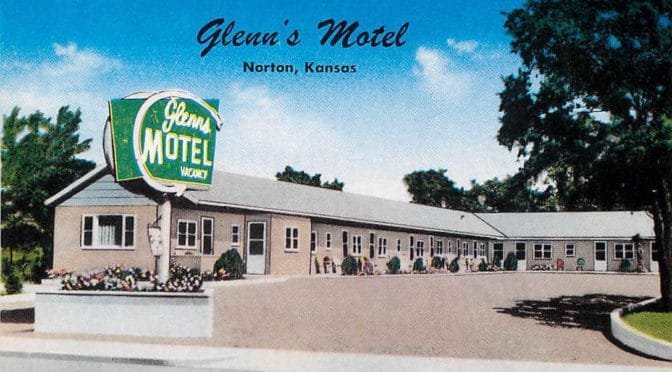
Updated: Kansas hotel guest tax collections
Kansas hotel guest tax collections presented in an interactive visualization. Updated through January 2019.
-

Wichita considers a new stadium
The City of Wichita plans subsidized development of a sports facility as an economic driver. Originally published in July 2017.
-

Wichita city sales tax passed
Wichita voters might be surprised to learn that they passed a city sales tax, according to city documents.
-

In Wichita, a gentle clawback
Despite the mayor’s bluster, Wichita mostly lets a company off the hook.
-

WichitaLiberty.TV: Economic development incentives
A look at some economic development incentive programs in Wichita and Kansas. Second in a series. Tax increment financing (TIF) is prominent in this episode.
-

Updated: Kansas tax receipts
Kansas tax receipts by category, presented in an interactive visualization.
-

WichitaLiberty.TV: Economic development incentives
A look at some economic development incentive programs in Wichita and Kansas. First in a series.
-
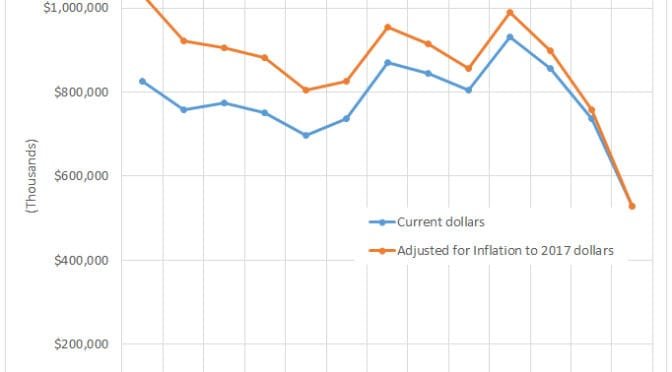
Kansas highway spending
A look at actual spending on Kansas highways, apart from transfers.
-
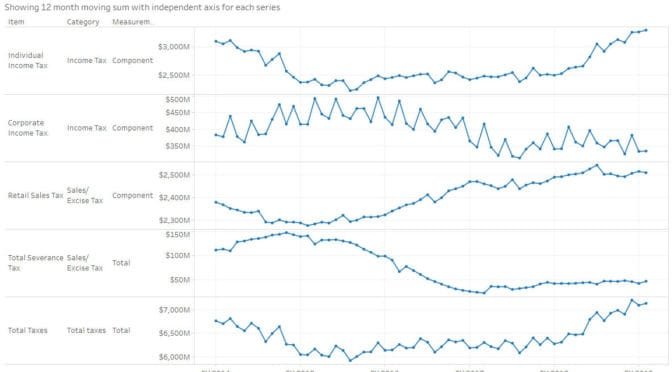
Kansas tax receipts
Kansas tax receipts by category, presented in an interactive visualization.
-

The use of sales tax proceeds in Wichita
Must the City of Wichita spend its share of Sedgwick County sales tax proceeds in a specific way?
-

More TIF spending in Wichita
The Wichita City Council will consider approval of a redevelopment plan in a tax increment financing (TIF) district.