Tag: Visualizations
-

National Assessment of Educational Progress (NAEP) for Kansas
Looking at Kansas school test scores as compared to the nation.
-
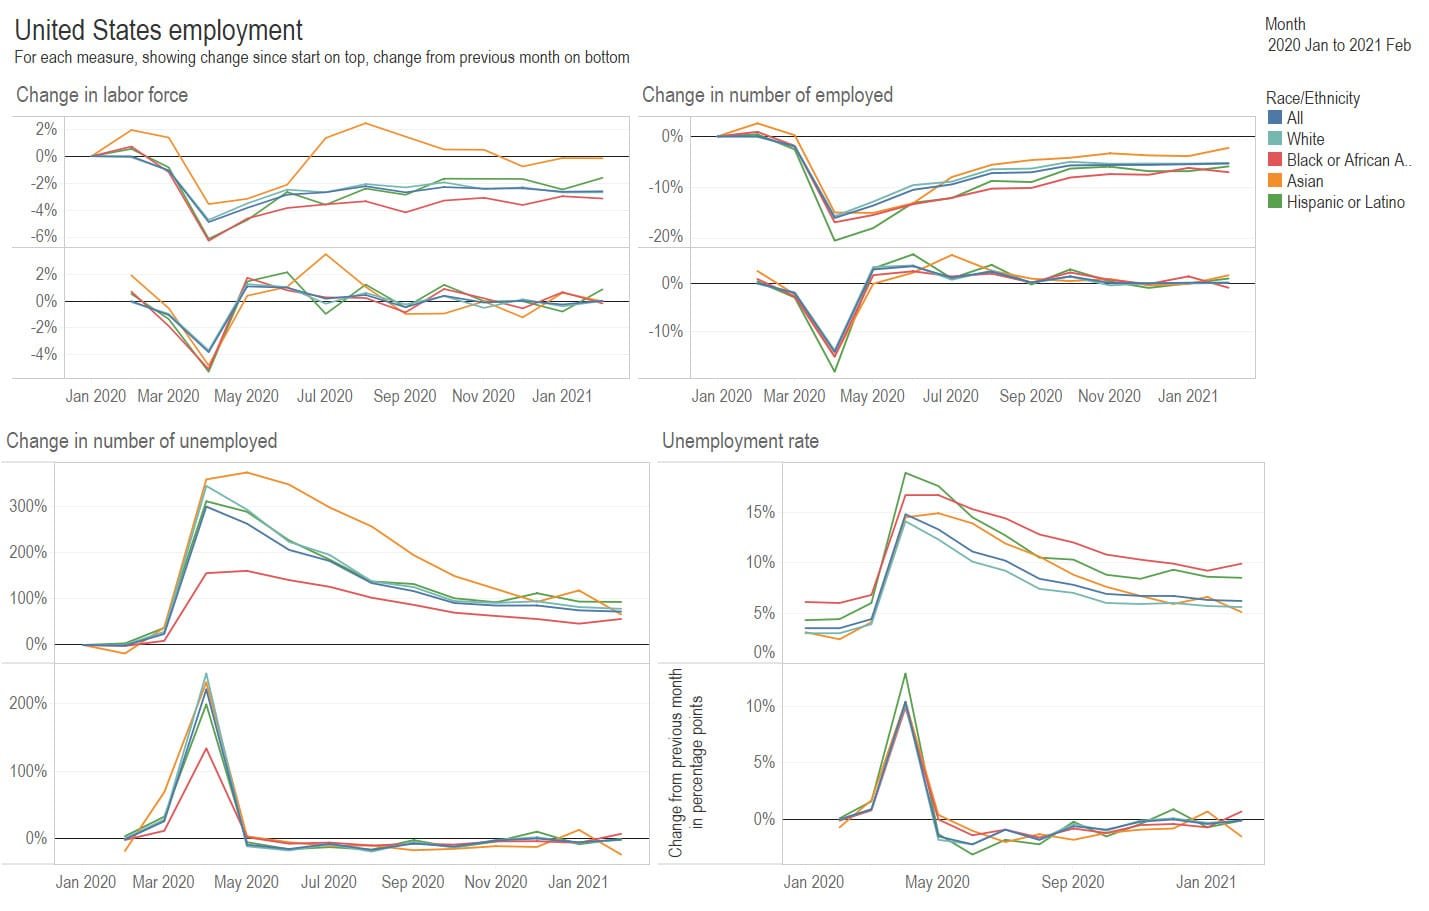
National employment, February 2021
The unemployment changed little in February 2021, but job growth was stronger than any month since October.
-
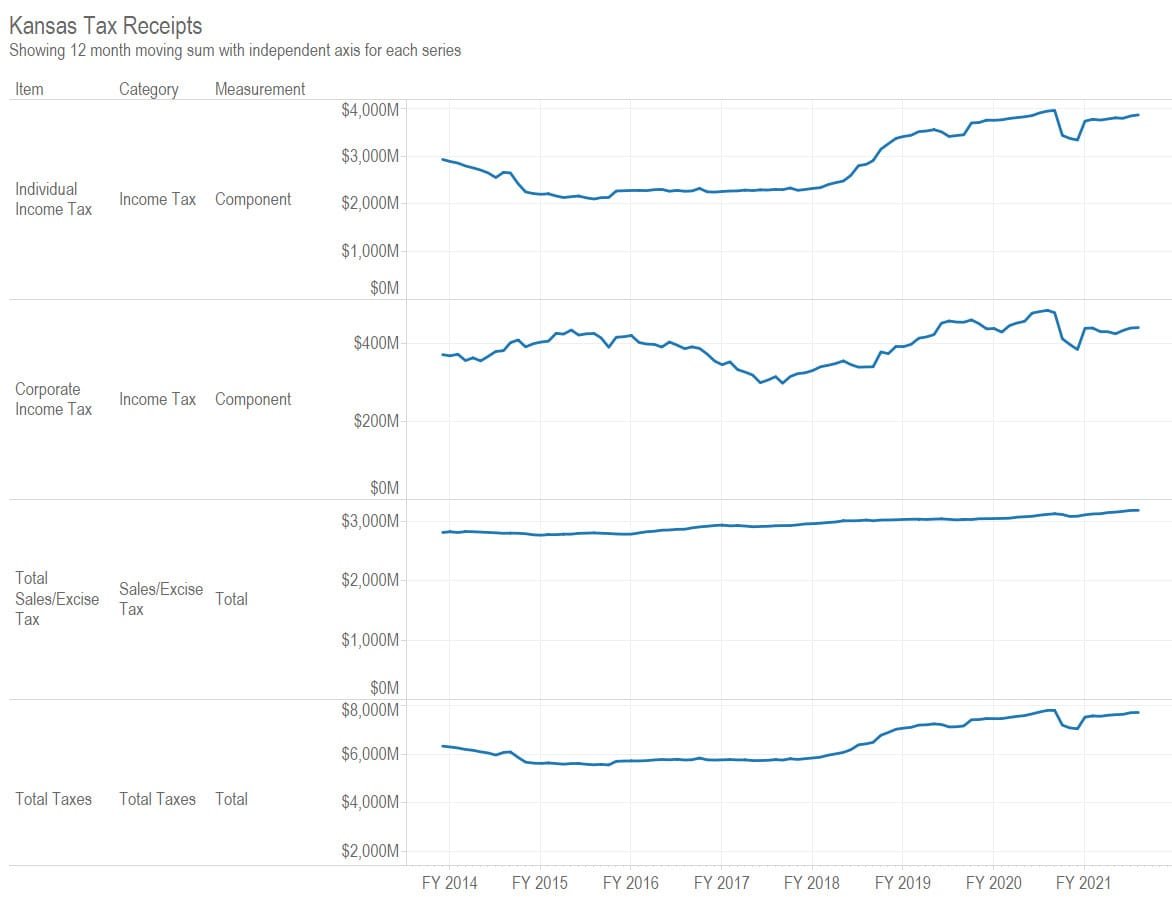
Kansas tax revenue, February 2021
For February 2021, Kansas tax revenue was 1.7 percent greater than February 2020. Over the eight months of the current fiscal year, revenue is 14.2 percent higher than at the same point of the previous year.
-
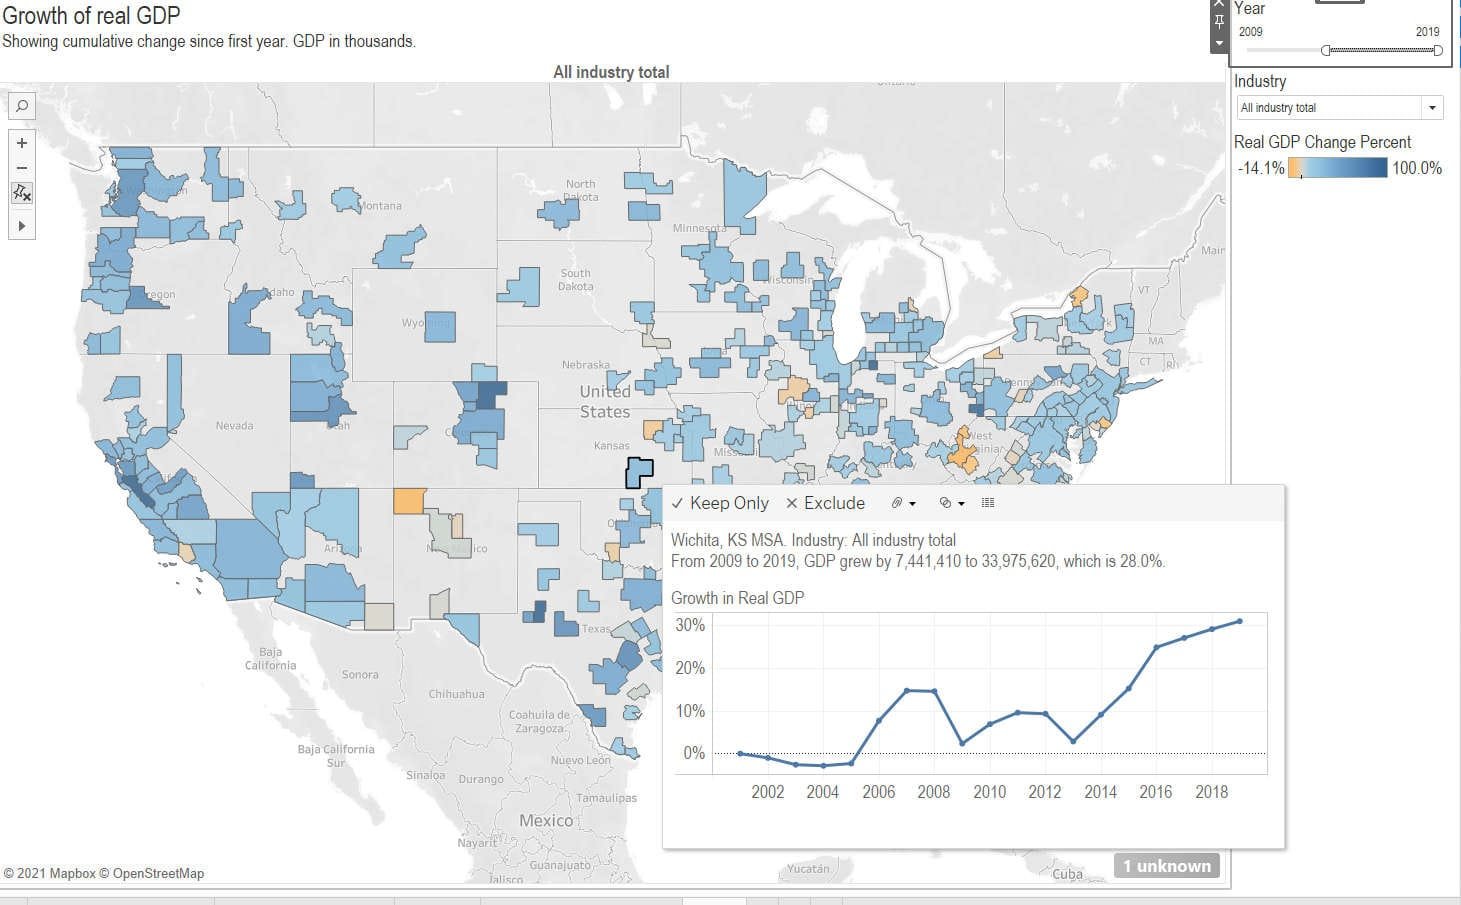
GDP by metropolitan area and component
An interactive visualization of gross domestic product by metropolitan area and industry.
-
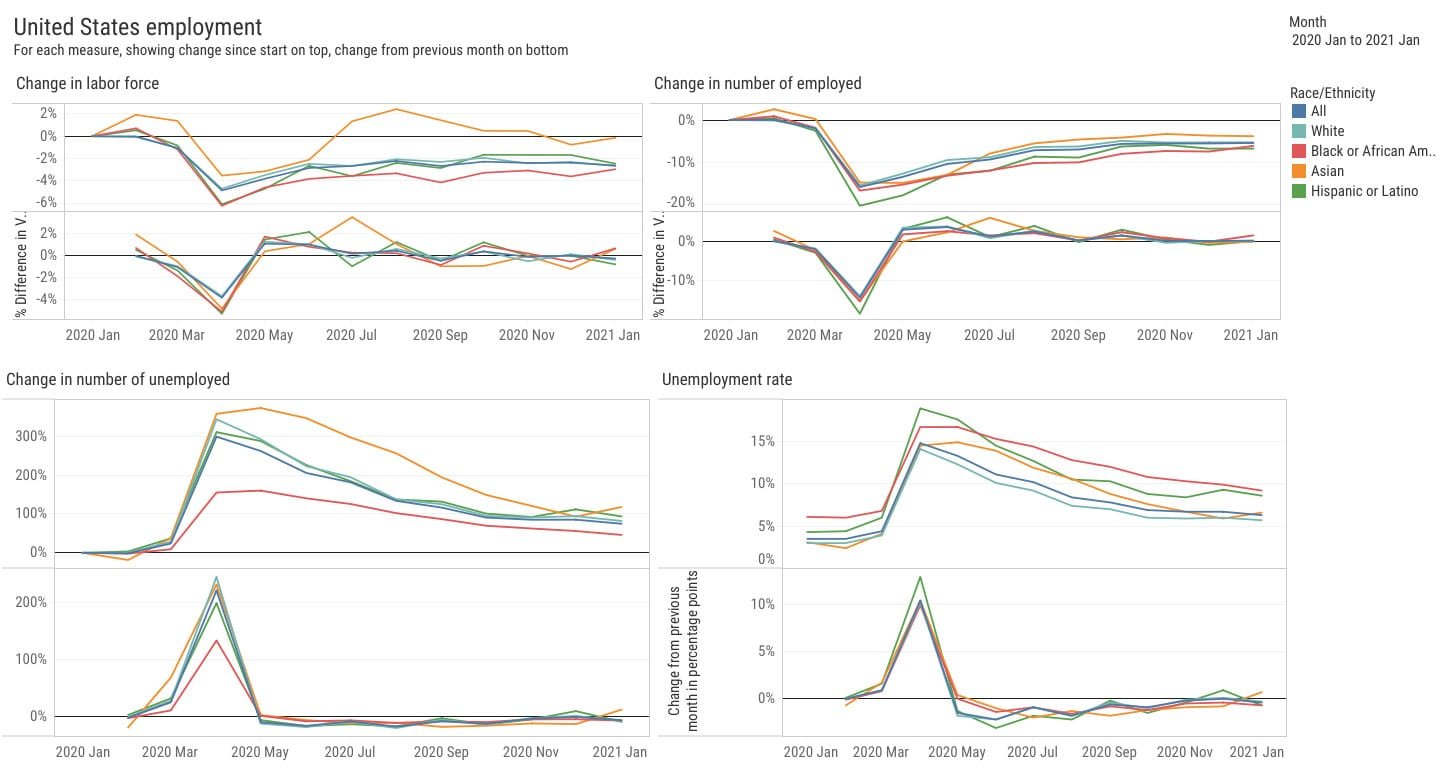
National employment, January 2021
The unemployment rate fell in January 2021, but job growth was weak, and the December value was revised.
-
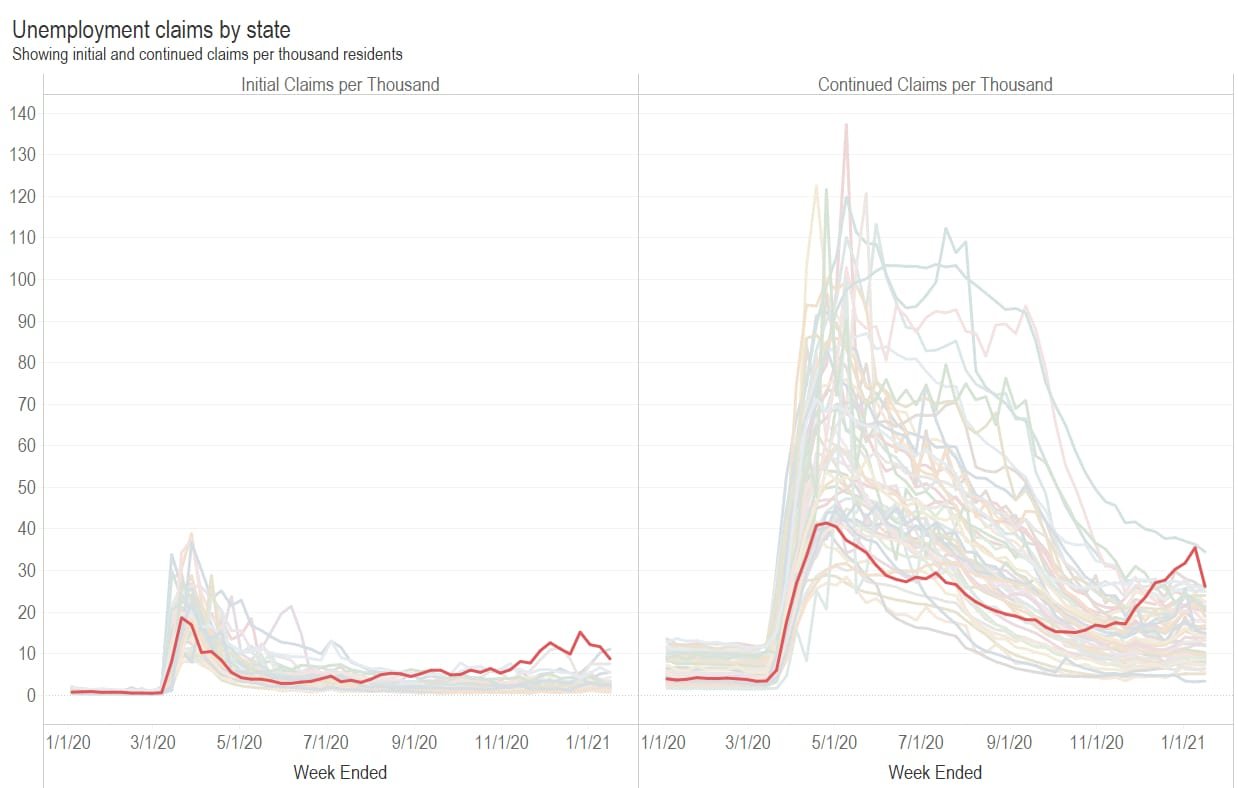
Kansas unemployment claims trending lower
A visualization of unemployment insurance claims by state, adjusted for population, shows Kansas as having a high number of claims, but trending lower.
-
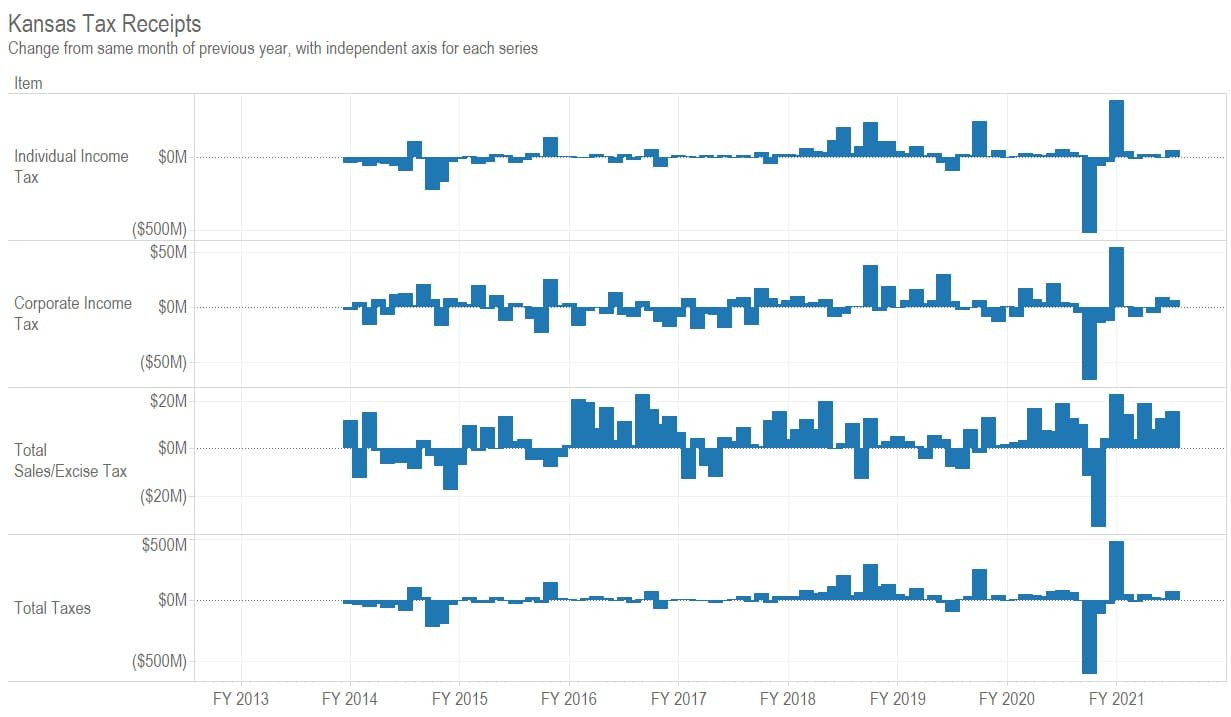
Kansas tax revenue, January 2021
For January 2021, total Kansas tax revenue was 9.7 percent greater than January 2020. Over the seven months of the current fiscal year, tax revenue is 15.5 percent higher than at the same point of the previous fiscal year.
-
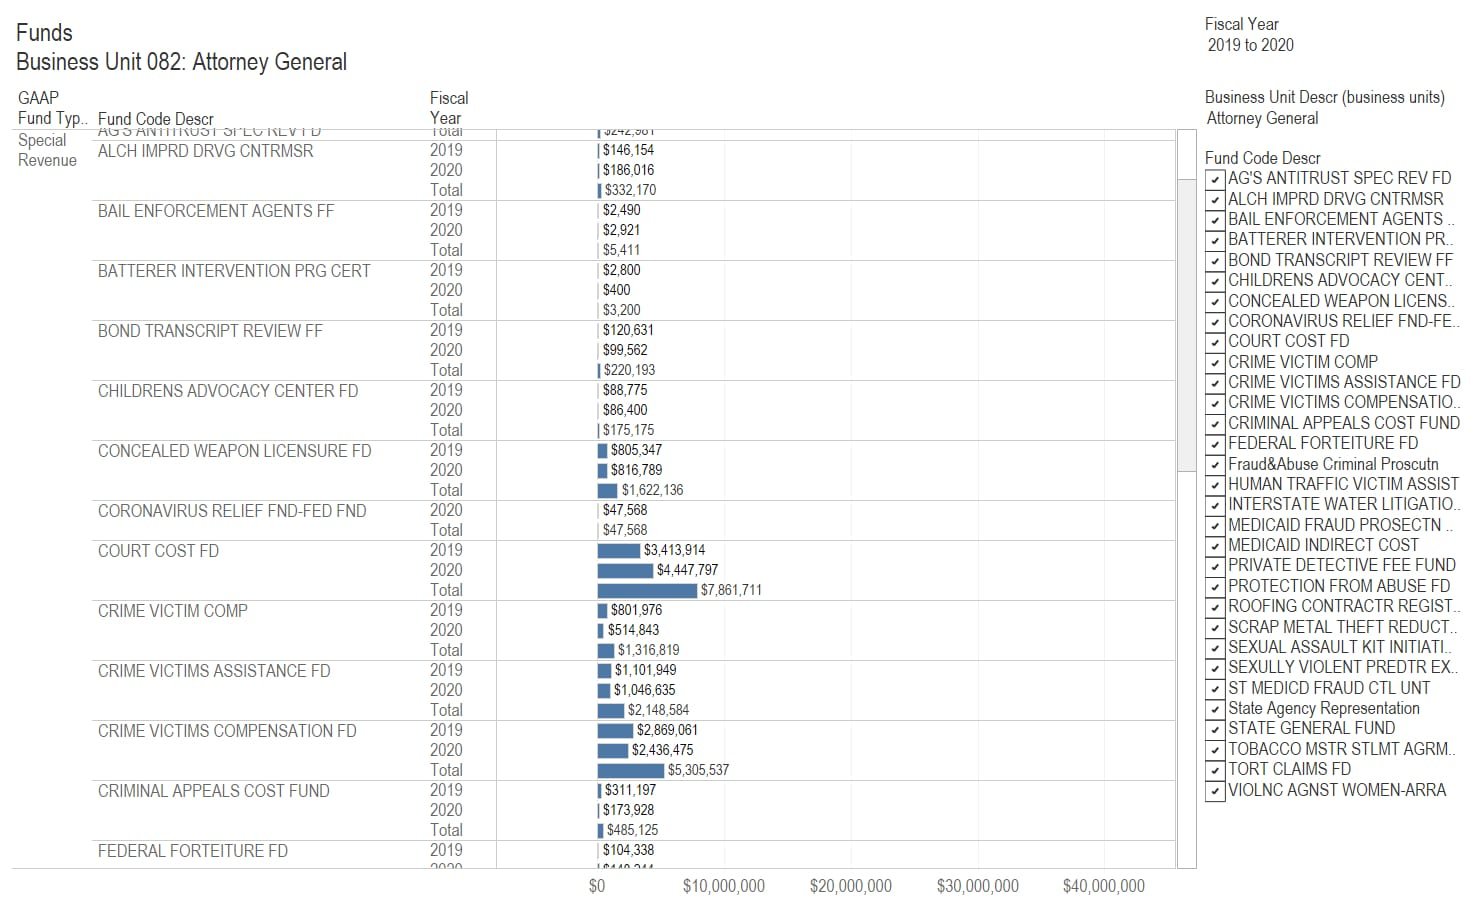
Kansas agency revenue
Data regarding State of Kansas agency revenue presented in an interactive visualization, with data through fiscal year 2020.
-
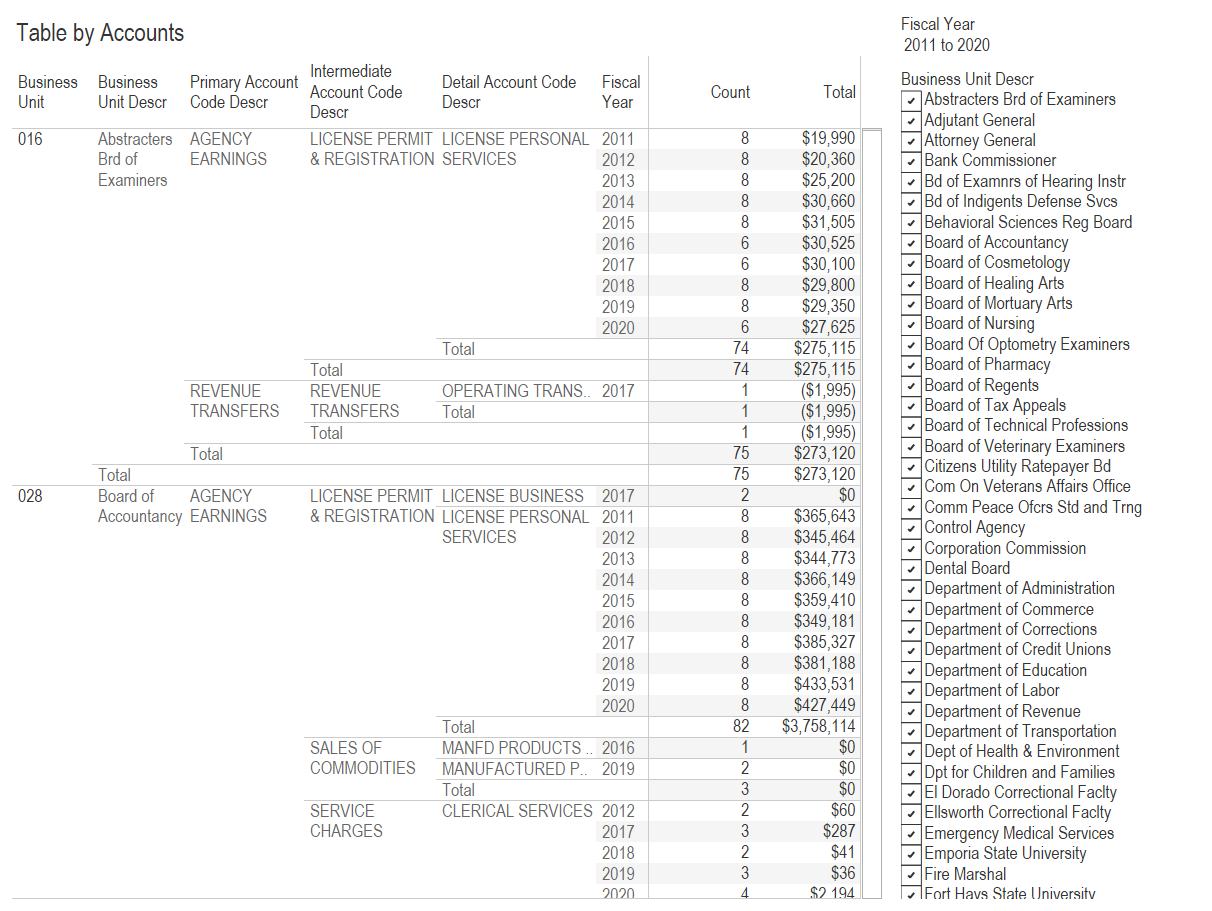
Kansas agency expenditures
Data regarding State of Kansas agency spending presented in an interactive visualization, with data through fiscal year 2020.
-
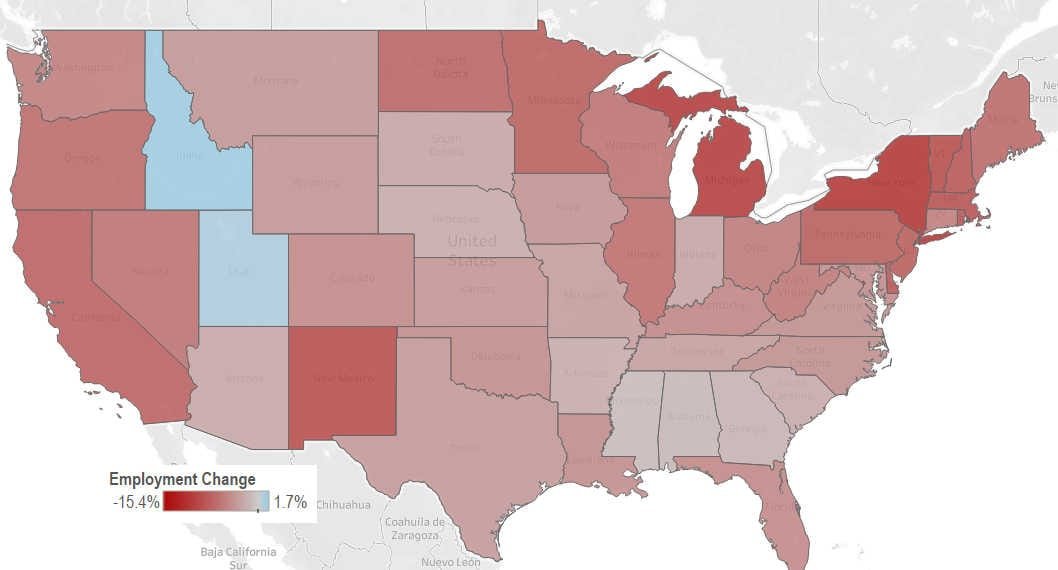
Effects of pandemic on employment in states
The effects of the response to the pandemic vary widely among the states.
-

Visualization: Kansas 2020 presidential election
An interactive visualization of the 2020 general election for president in Kansas, at the precinct level.
-
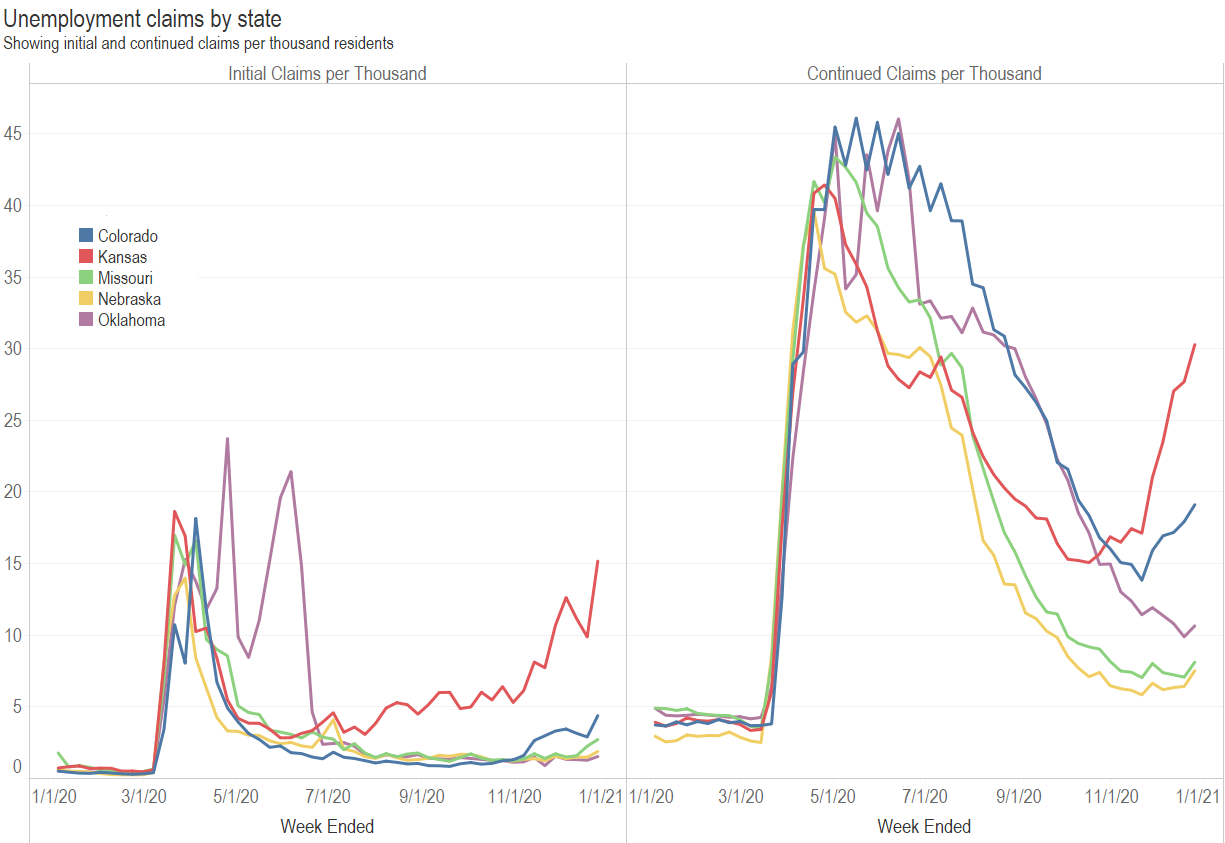
Kansas unemployment claims are high and rising
A visualization of unemployment insurance claims by state, adjusted for population, shows Kansas as an outlier among states.