Tag: Visualizations
-
Tax collections by the states
An interactive visualization of tax collections by state governments.
-

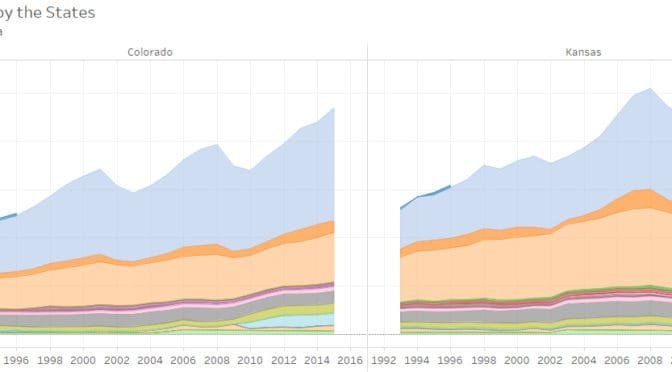
Personal income in the states
An interactive visualization of income growth and change in the states, by major sector.
-
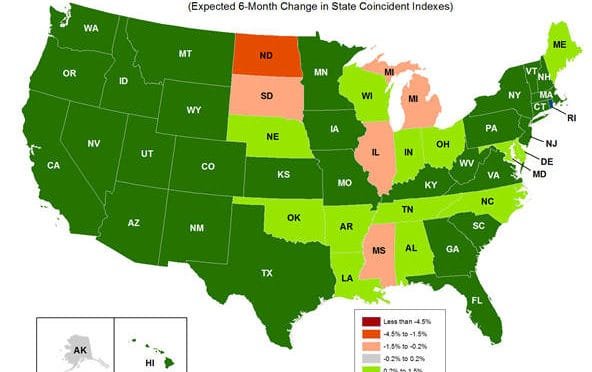
Economic indicators for the states
An index of past economic activity for each state, and another index looking forward.
-
Kansas tax receipts
Kansas tax receipts by category, presented in an interactive visualization.
-

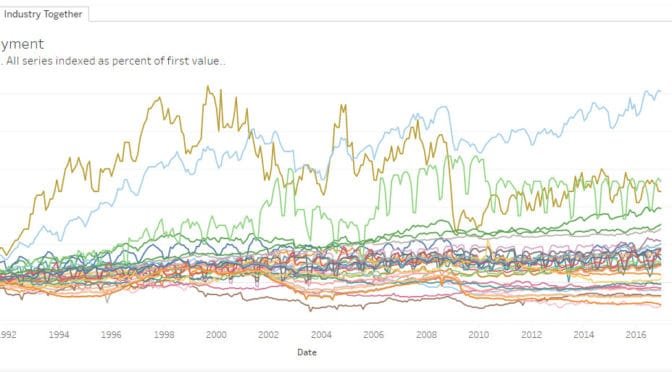
Kansas employment by industry
An interactive visualization of Kansas employment by industry.
-
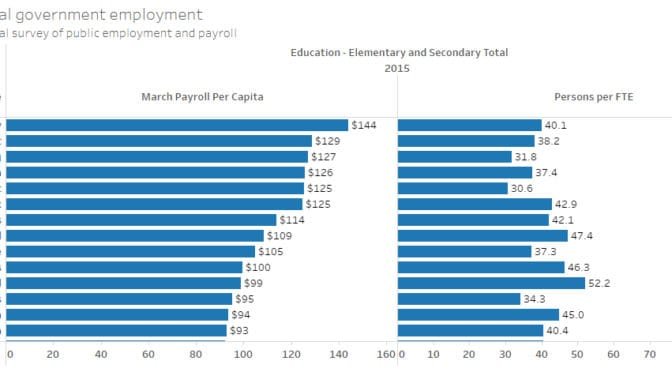
State and local government employee and payroll
Considering all state and local government employees in proportion to population, Kansas has many, compared to other states, and especially so in education.
-
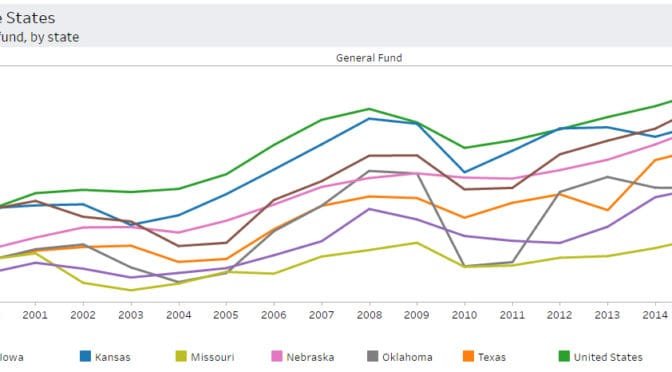
Spending in the states, by fund
The National Association of State Budget Officers publishes spending data for the states. In this interactive visualization, I present the data in a graphical and flexible format.
-
Wichita metro employment by industry
An interactive visualization of Wichita-area employment by industry.
-

Kansas state school assessments
An interactive presentation of Kansas state school assessment scores at the state, district, and building levels.
-
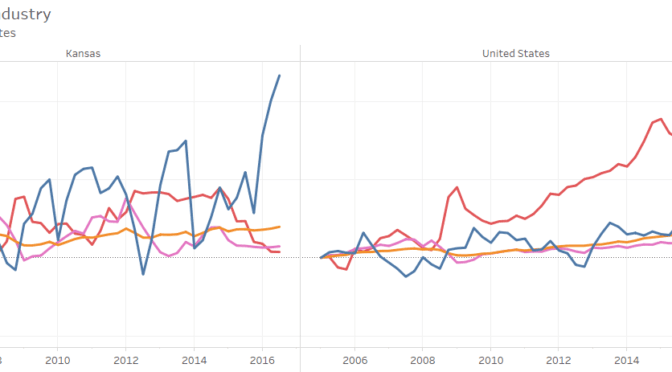
GDP by state and industry
An interactive visualization of GDP for each state, by industry.
-

Kansas school employment
Kansas school employment rose slightly for the current school year, and ratios of employees to pupils fell, also slightly.
-

Kansas school spending, an interactive visualization
An interactive visualization of spending for Kansas school districts.