Tag: Visualizations
-

Pupil-teacher ratios in the states
Kansas ranks near the top of the states in having a low pupil-teacher ratio.
-
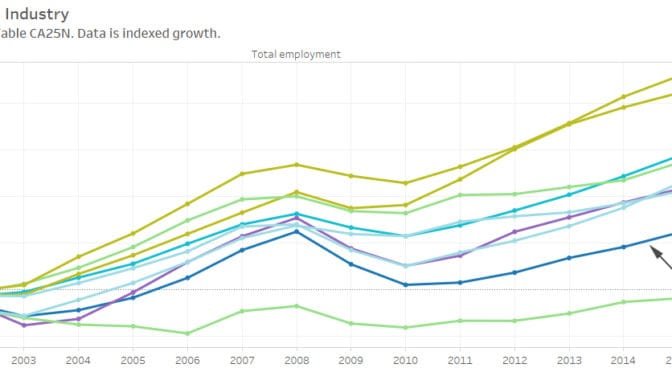
Employment by MSA and industry
An interactive visualization of employment in metropolitan areas.
-
Kansas school employees by type
An interactive visualization of trends in Kansas school employment.
-

Spending in the States
The National Association of State Budget Officers publishes spending data for the states. In this interactive visualization, I present the data in a graphical and flexible format.
-

Airport traffic statistics
Airport traffic data presented in an interactive visualization.
-
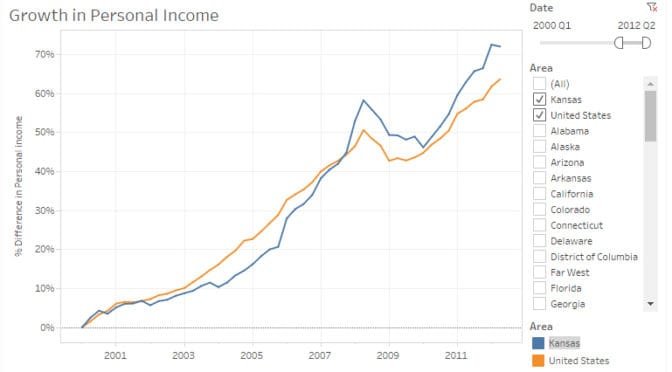
Personal income in the states
An interactive visualization of personal income growth and change in the states.
-

Kansas school spending: Visualization
An interactive visualization of revenue and spending data for Kansas school districts.
-
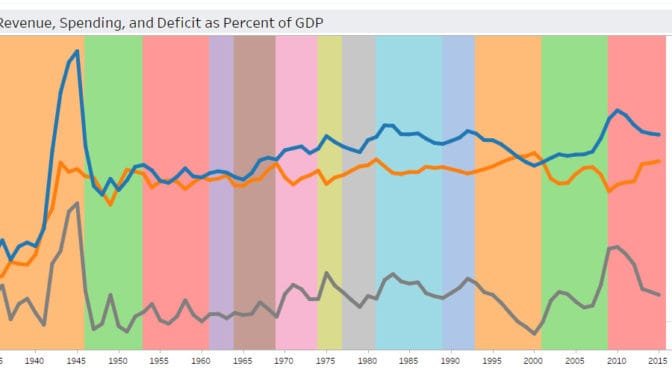
National economic statistics
Gross Domestic Product and spending, in an interactive visualization.
-
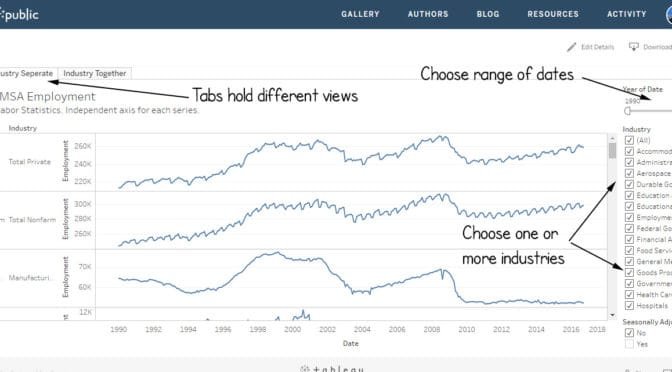
Wichita MSA employment
An interactive visualization of Wichita-area employment by industry.
-
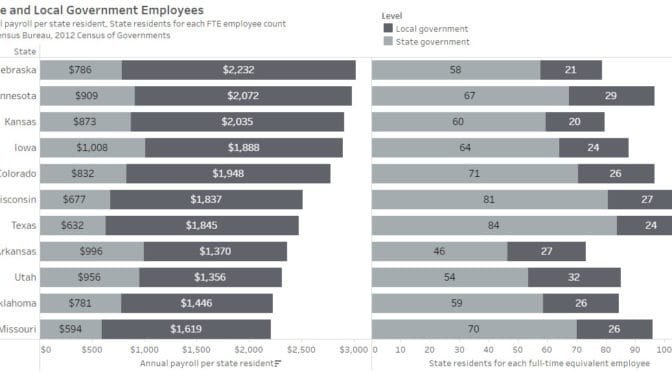
Kansas, a frugal state?
Is Kansas a frugal state, compared to others?
-
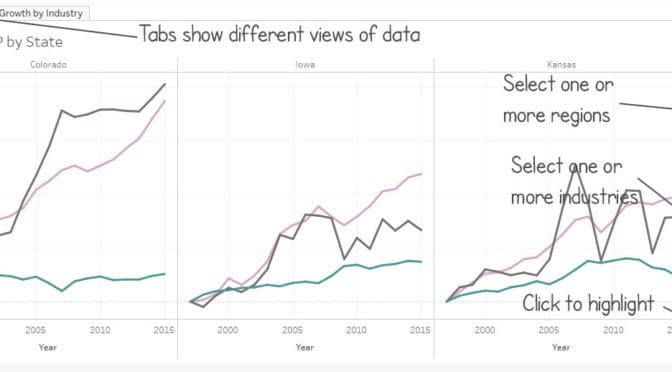
GDP by state and component
An interactive visualization of gross domestic product by state and industry.
-
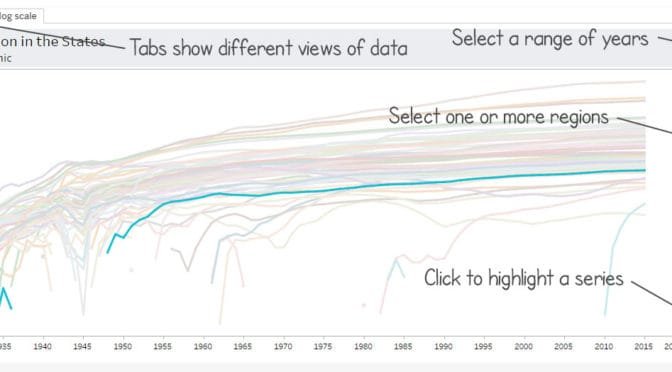
Populations of the states
An interactive table and charts of populations in the states and regions, starting in 1929.