Tag: Visualizations
-
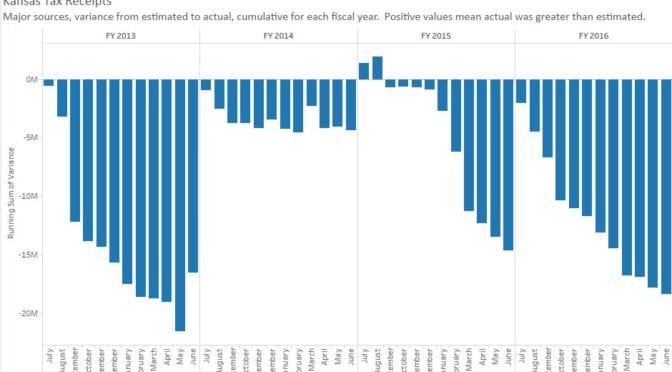
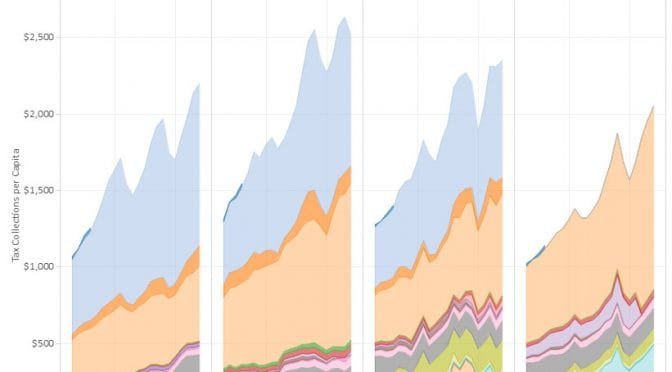
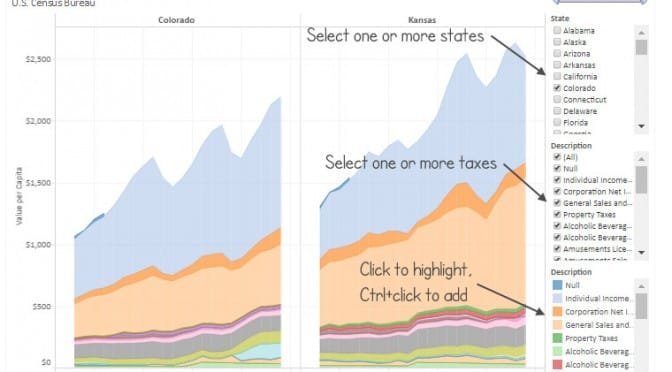
Kansas tax receipts
Kansas tax receipts by category, presented in an interactive visualization.
-
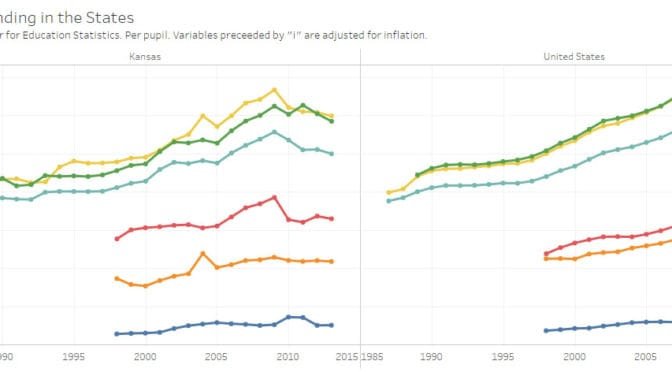
School spending in the states
School spending in the states, presented in an interactive visualization.
-
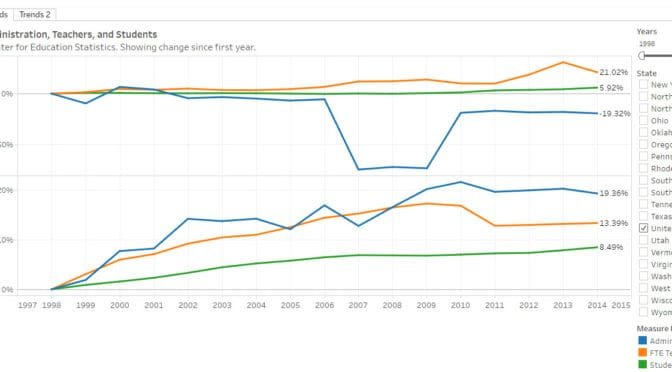
School staffing and students
Trends for the nation and each state in teachers, administrators, and students, presented in an interactive visualization.
-

Kansas tax receipts
Kansas tax receipts by category, presented in an interactive visualization.
-
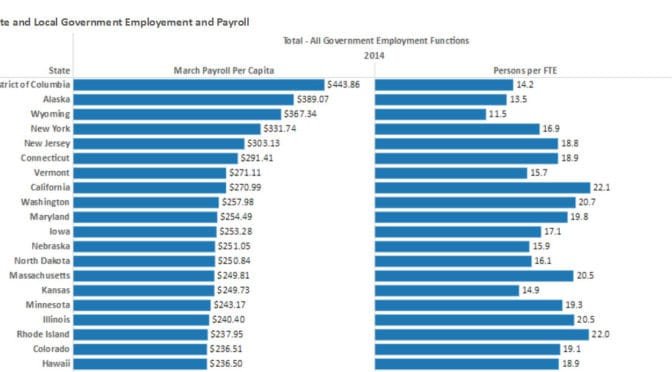
State and local government employee and payroll
Considering all state and local government employees in proportion to population, Kansas has many, compared to other states, and especially so in education.
-
State and local direct general expenditures
An interactive visualization of state and local direct general expenditures, per capita.
-
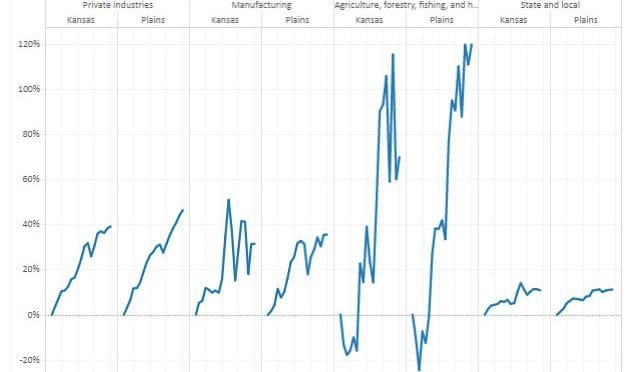
GDP by state and industry
An interactive visualization of gross domestic product by state and industry.
-
Kansas state tax collections, compared
An interactive visualization of tax collections by state governments shows Kansas distinguished from some of its neighbors.
-
GDP by state and industry
An interactive visualization of gross domestic product by state and industry from the Bureau of Economic Analysis.
-
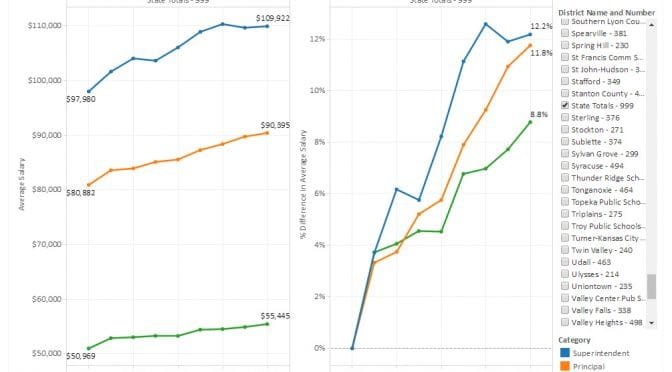
Kansas school salaries
Kansas school salaries for superintendents, principals, and teachers presented in an interactive visualization for each district, updated for 2016 data.
-

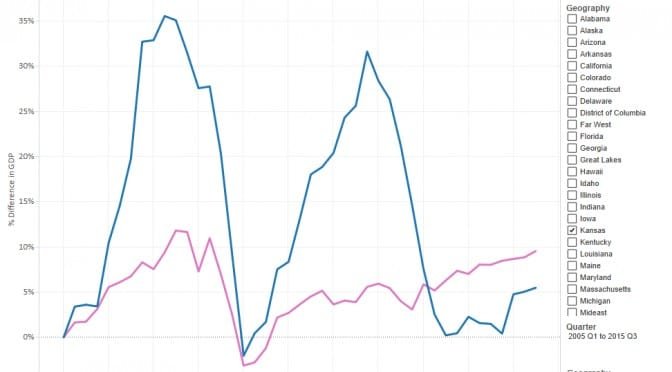
Economic indicators in the states
During this century the Kansas economy has not kept up with the national economy and most neighboring states.
-
Tax collections by the states
An interactive visualization of tax collections by state governments.