Tag: Visualizations
-
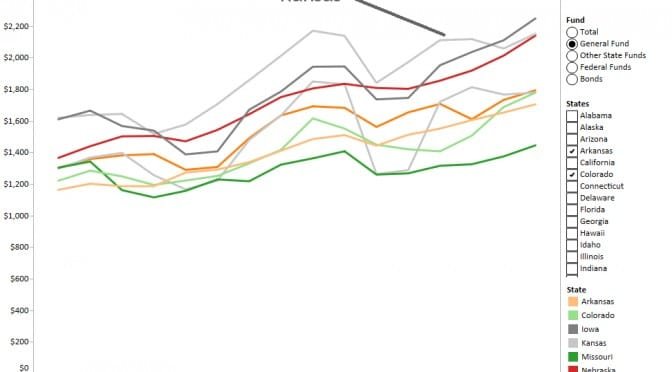
Spending in the states, per capita
An interactive visualization of per-capita spending in the states, by fund.
-
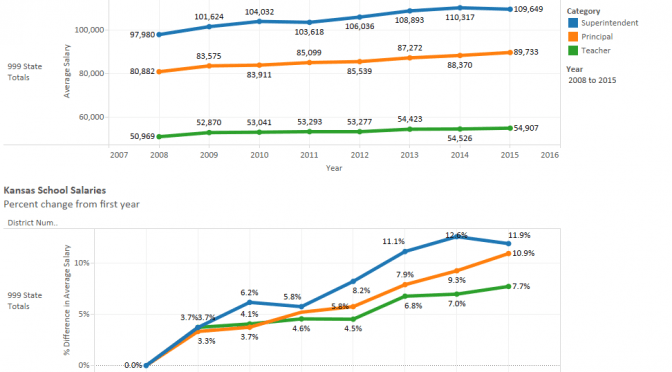
Kansas school salaries
Kansas school salaries for superintendents, principals, and teachers presented in an interactive visualization for each district.
-
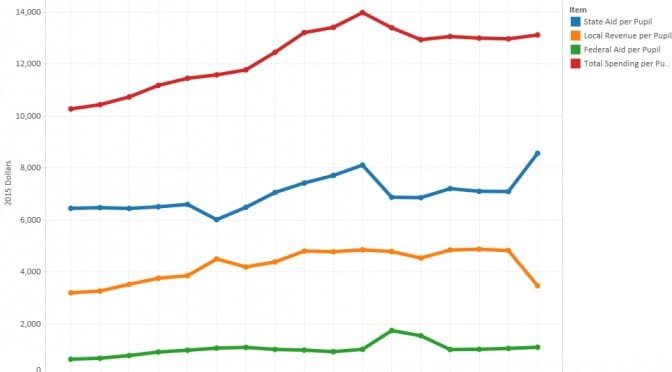
Kansas school spending: Visualization
An interactive visualization of revenue and spending data for Kansas school districts.
-
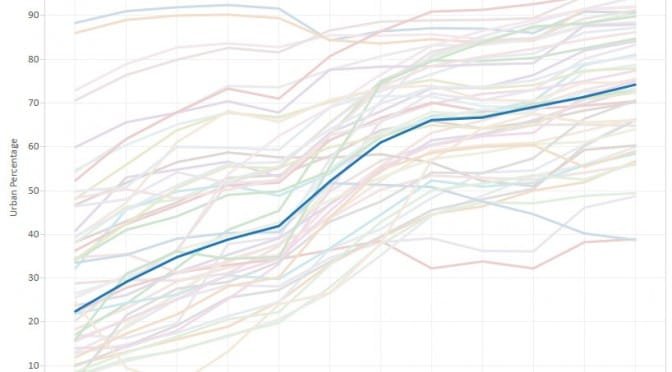
Kansas, a rural state?
How does the population in Kansas compare to the nation and other states?
-
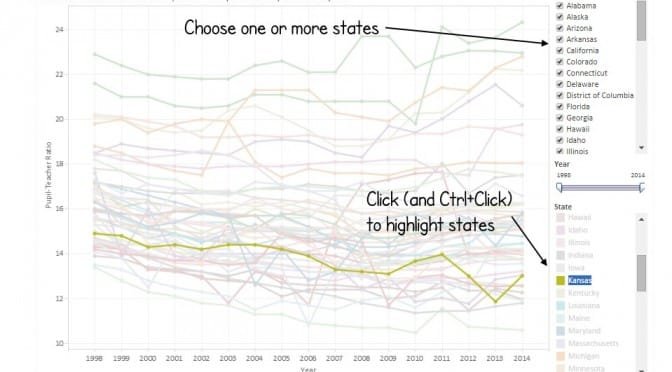
Pupil-teacher ratios in the states
Kansas ranks near the top of the states in having a low pupil-teacher ratio.
-
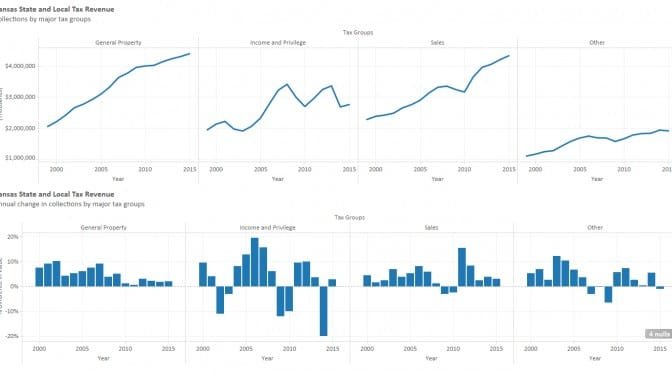
Kansas state and local tax revenue
Kansas state and local tax revenue
-

Kansas school employment
Kansas school employment declined for the current school year, and ratios of employees to pupils rose.
-
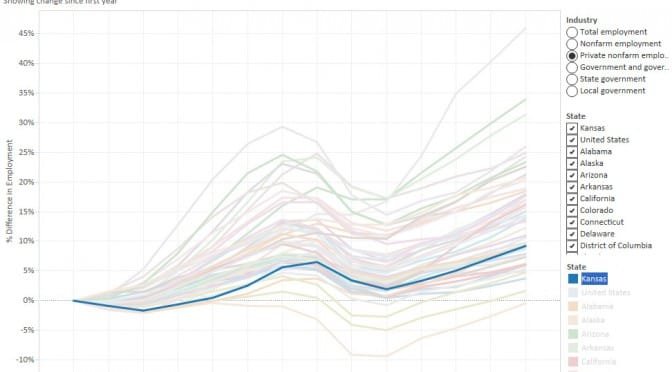
Employment by state and industry
An interactive visualization of employment in the states.
-

Employment by metropolitan area
An interactive visualization of employment in metropolitan areas.
-
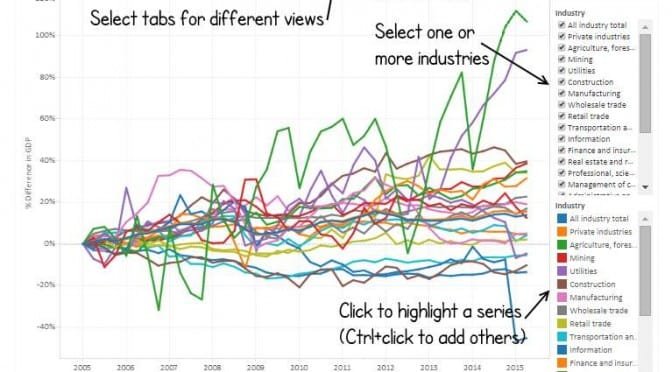
GDP by state and industry
An interactive visualization of a new data series from the Bureau of Economic Analysis.
-
Kansas school employees by type
An interactive visualization of trends in Kansas school employment.
-
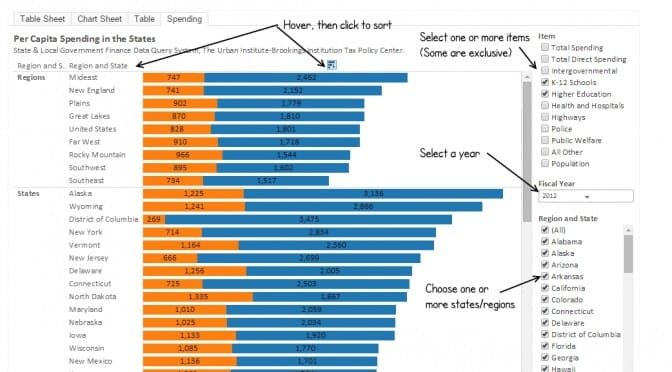
Spending in the states, per capita
An interactive visualization holding per-capita spending in several categories for each state.