Tag: Visualizations
-
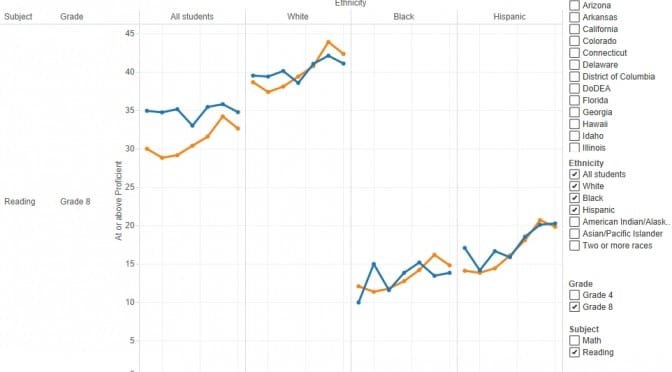
Kansas NAEP scores for 2015
Reactions to the release of National Assessment of Educational Progress scores for Kansas and the nation. Also, an interactive visualization.
-
Sedgwick County delinquent property tax
An interactive version of the list of delinquent property taxes in Sedgwick County.
-
Kansas school support
An interactive visualization of data provided to members of the Kansas 2015 Special Committee on K-12 Student Success.
-
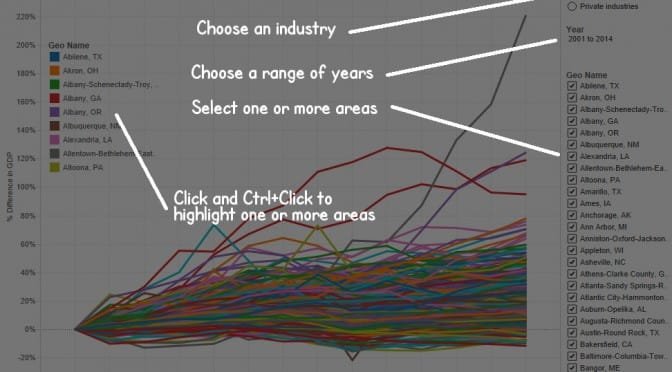
Wichita’s growth in gross domestic product
An interactive visualization of gross domestic product for metropolitan areas.
-
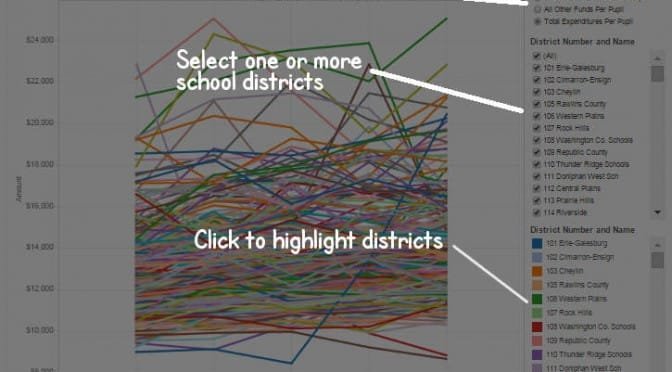
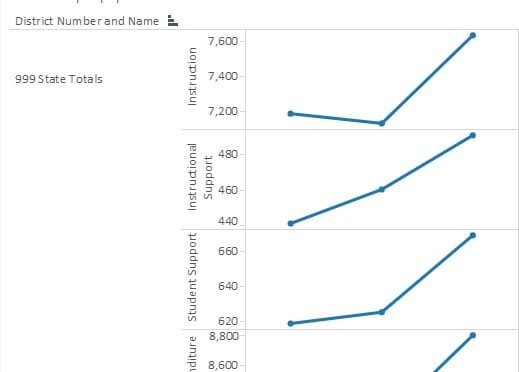
Kansas school expenditures per pupil
The Kansas State Department of Education publishes a series of worksheets titled Expenditures Per Pupil. Here is the data gathered and presented in an interactive visualization.
-

Kansas school fund balances
Kansas school fund balances rose slightly this year, both in absolute dollars and dollars per pupil.
-
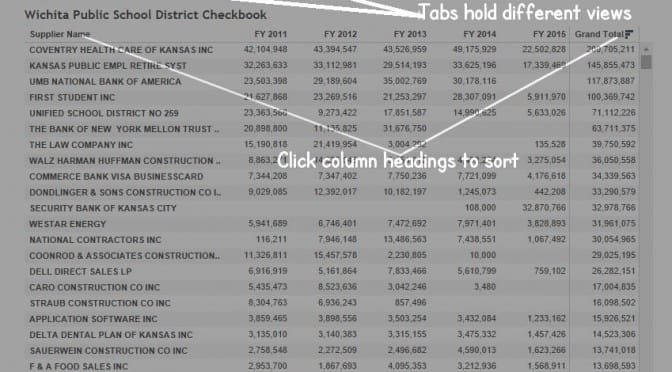
Wichita school district checkbook updated
An interactive table of checkbook spending by the Wichita public school district.
-

Kansas private nonfarm employment by county
An interactive visualization of private nonfarm employment in Kansas, for each county.
-
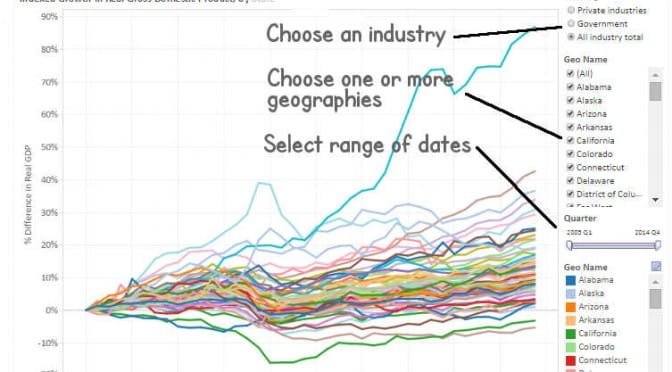
Quarterly gross domestic product by state
The U.S. Bureau of Economic Analysis (BEA) is releasing prototype quarterly gross domestic product (GDP) by state statistics for 2005–2014. Here is an interactive visualization.
-

Taxation in the states
Examining tax collections by the states shows that Kansas collects more tax than many of our neighbors, and should put to rest some common myths.
-
Spending in the states, a visualization
An interactive visualization of state spending per person.
-
Kansas school test scores, an untold story
If the Kansas public school establishment wants to present an accurate assessment of Kansas schools, it should start with its presentation of NAEP scores.