Tag: Visualizations
-

Kansas school test scores, two interactive visualizations
When comparing Kansas school test scores to those of other states or the nation, it’s important to consider disaggregated data. Otherwise, we may make inaccurate conclusions regarding Kansas schools.
-
Populations of the states
An interactive visualization with four views of the populations of the states, 1900 to 2014.
-

Economic indicators for Kansas
During this century the Kansas economy has not kept up with the national economy and most neighboring states.
-
Wichita marijuana ballot issue, April 7, 2015
Following is a map of voting for the Wichita marijuana ballot issue, April 7, 2015.
-
Wichita mayoral vote map, April 7, 2015
Following is a map of voting for the Wichita mayoral contest, April 7, 2015.
-
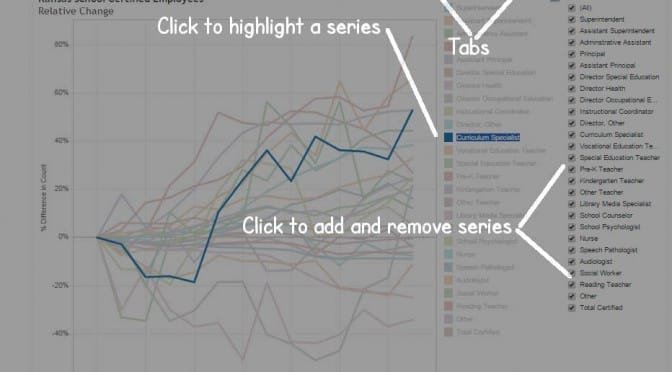
Kansas school employees by type
An interactive visualization of trends in Kansas school employment.
-

On Kansas tax experiment, we do know what doesn’t work: High taxes
Those who criticize lower Kansas tax rates tax rates as an experiment that may not work should be aware that we know with certainty what hasn’t worked in Kansas.
-
Kansas school bonds outstanding
Here is a table and chart of bond activity by Kansas school districts.
-
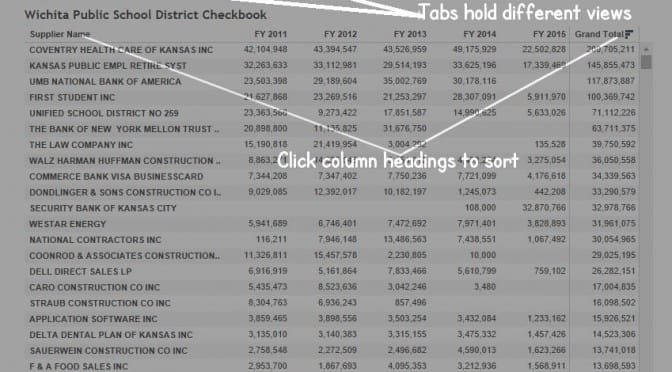
Wichita school district checkbook updated
An interactive table of checkbook spending by the Wichita public school district.
-

Kansas is not an entrepreneurial state
The performance of Kansas in entrepreneurial activity is not high, compared to other states.
-
GDP change by metro area by industry
Data from Bureau of Economic Analysis, part of the U.S. Department of Commerce. To access the interactive version of the visualization, click here.
-

Kansas school teacher cuts, student ratios
What has been the trend in Kansas school employment and pupil-teacher ratio?