Tag: Visualizations
-

Kansas Tax Revenue, October 2023
For October 2023, Kansas tax revenue was 7.4 percent lower than October 2022, and 4.1 percent lower than estimated.
-

Firearm Mortality by State, AI Version
Artificial intelligence reads charts. Sometimes.
-
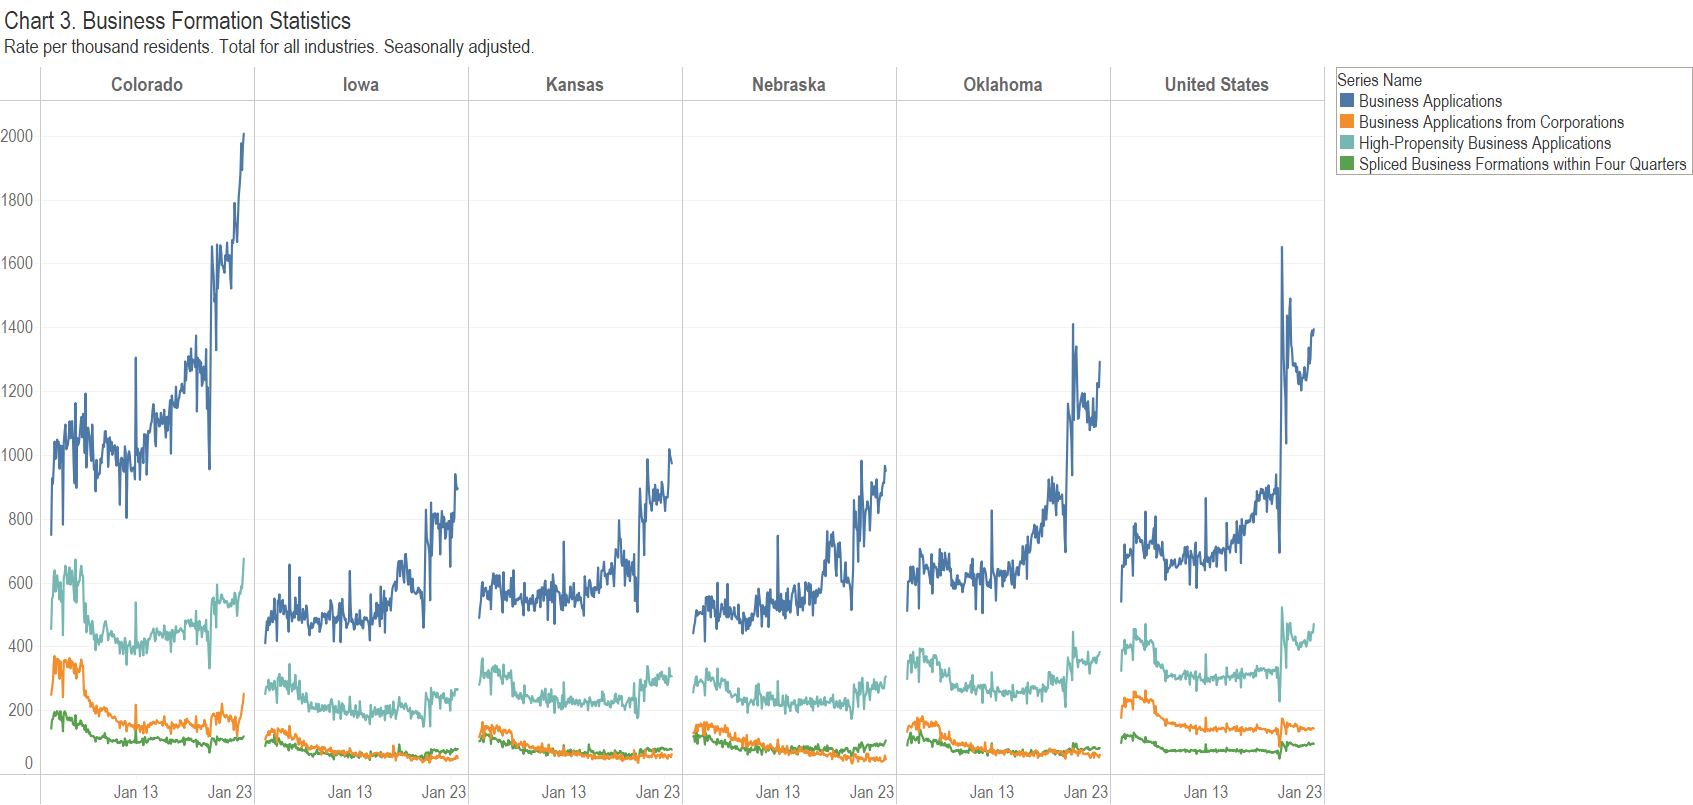
Business Formation in Kansas
For both business applications and business formations, Kansas does better than some states, but lags many states and the nation.
-
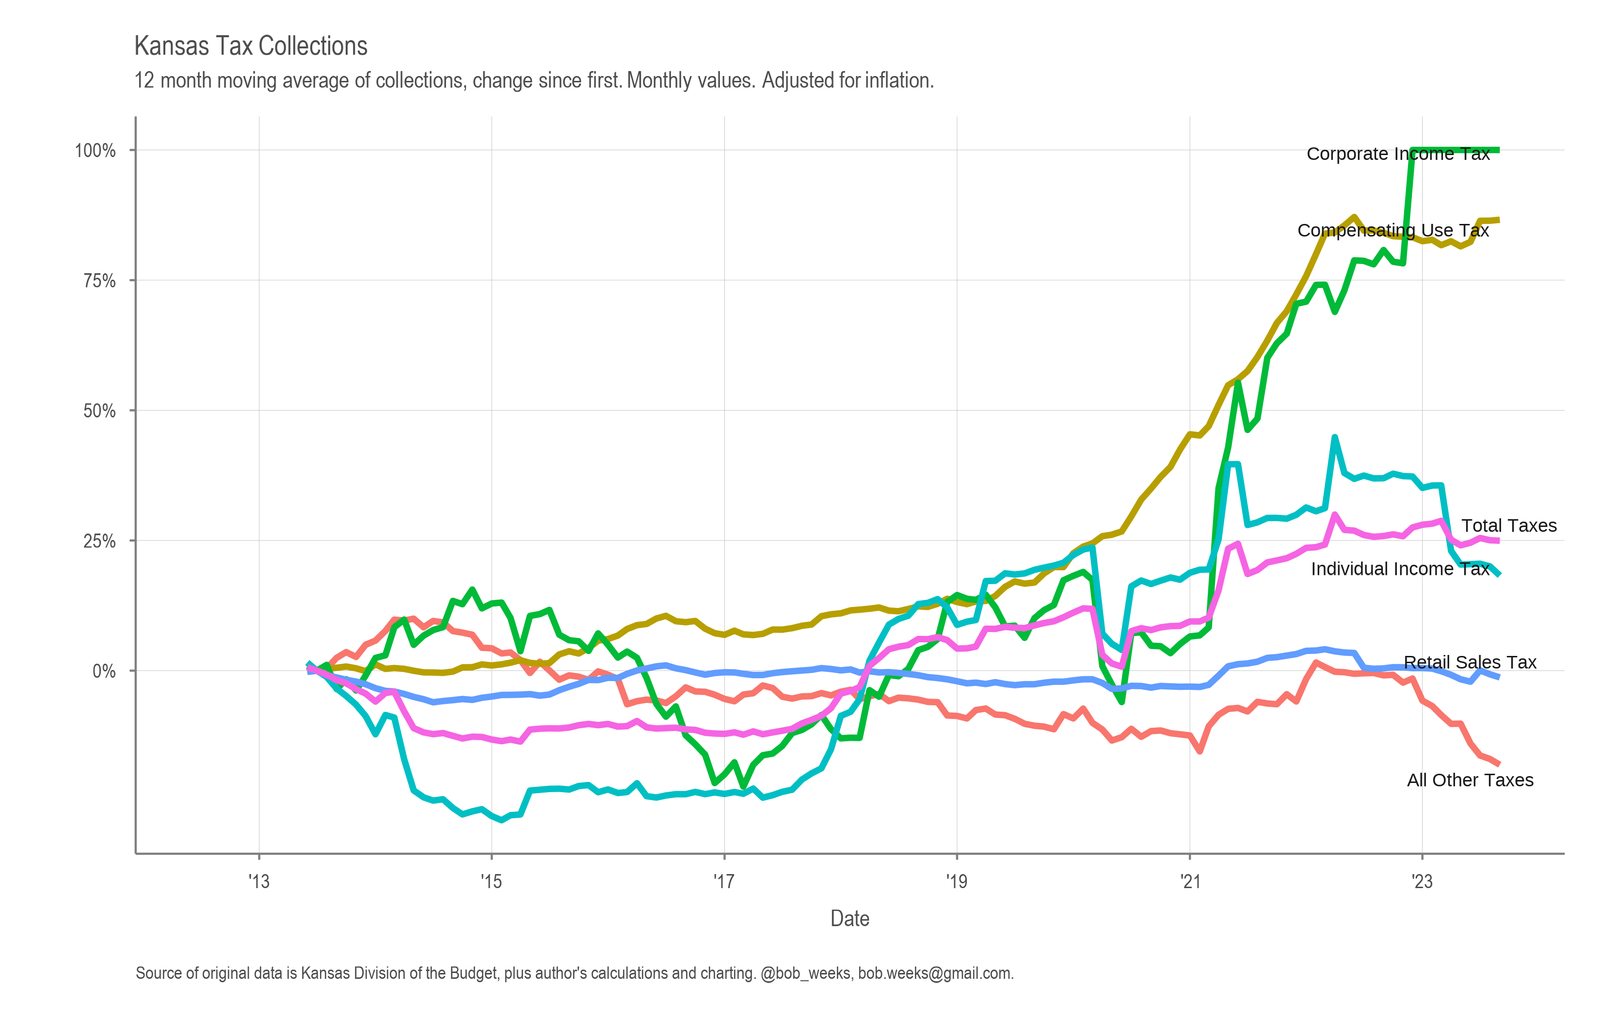
Kansas Tax Revenue, September 2023
For September 2023, Kansas tax revenue was 3.2 percent lower than September 2022, and 4.4 percent higher than estimated.
-
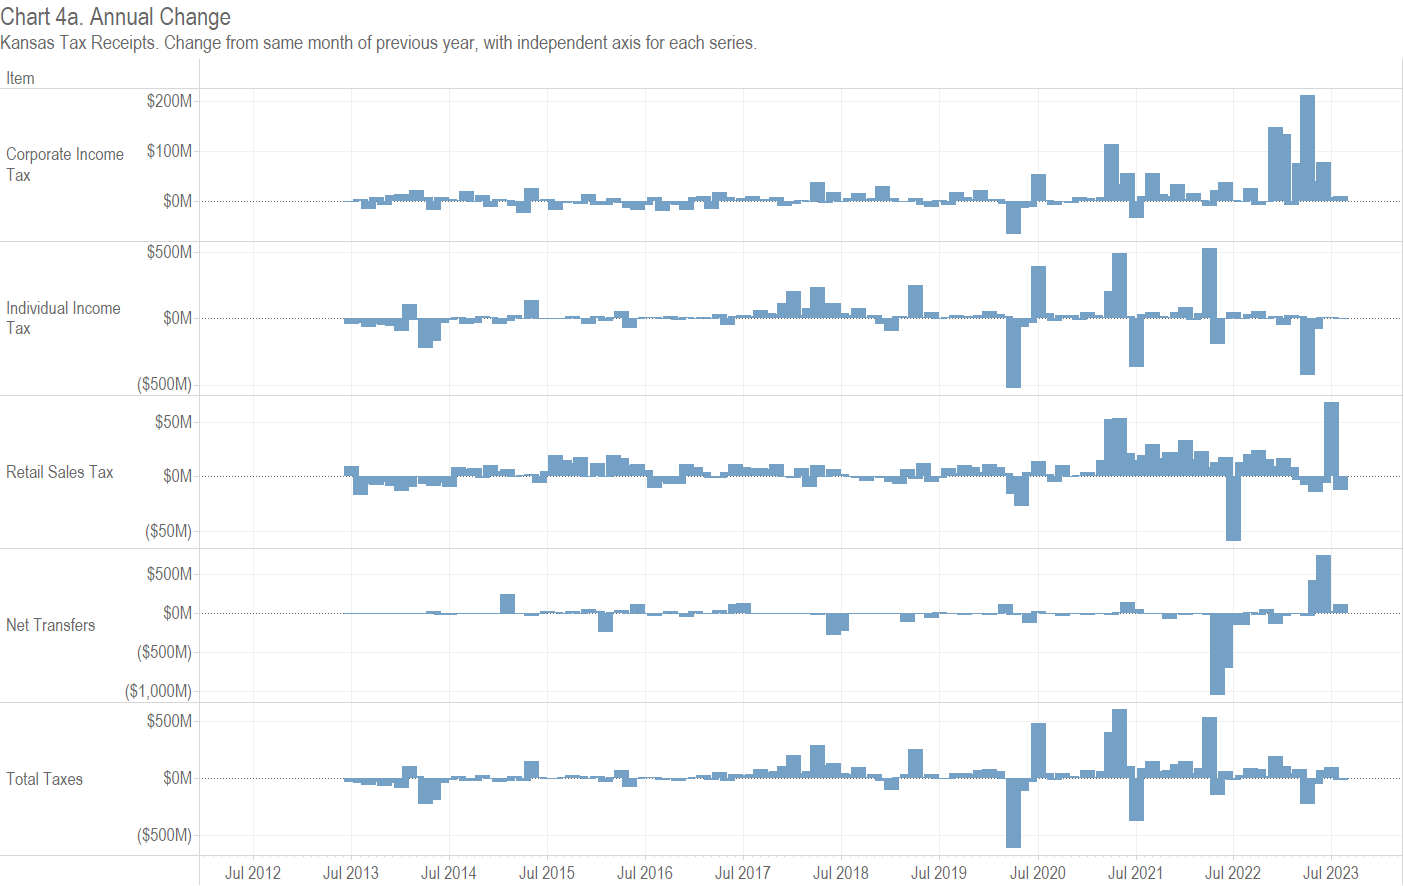
Kansas Tax Revenue, August 2023
For August 2023, Kansas tax revenue was 1.9 percent lower than August 2022, and 3.7 percent less than estimated.
-

Kansas Tax Revenue, July 2023
For July 2023, Kansas tax revenue was 16.2 percent higher than July 2022, and 2.1 percent more than estimated.
-
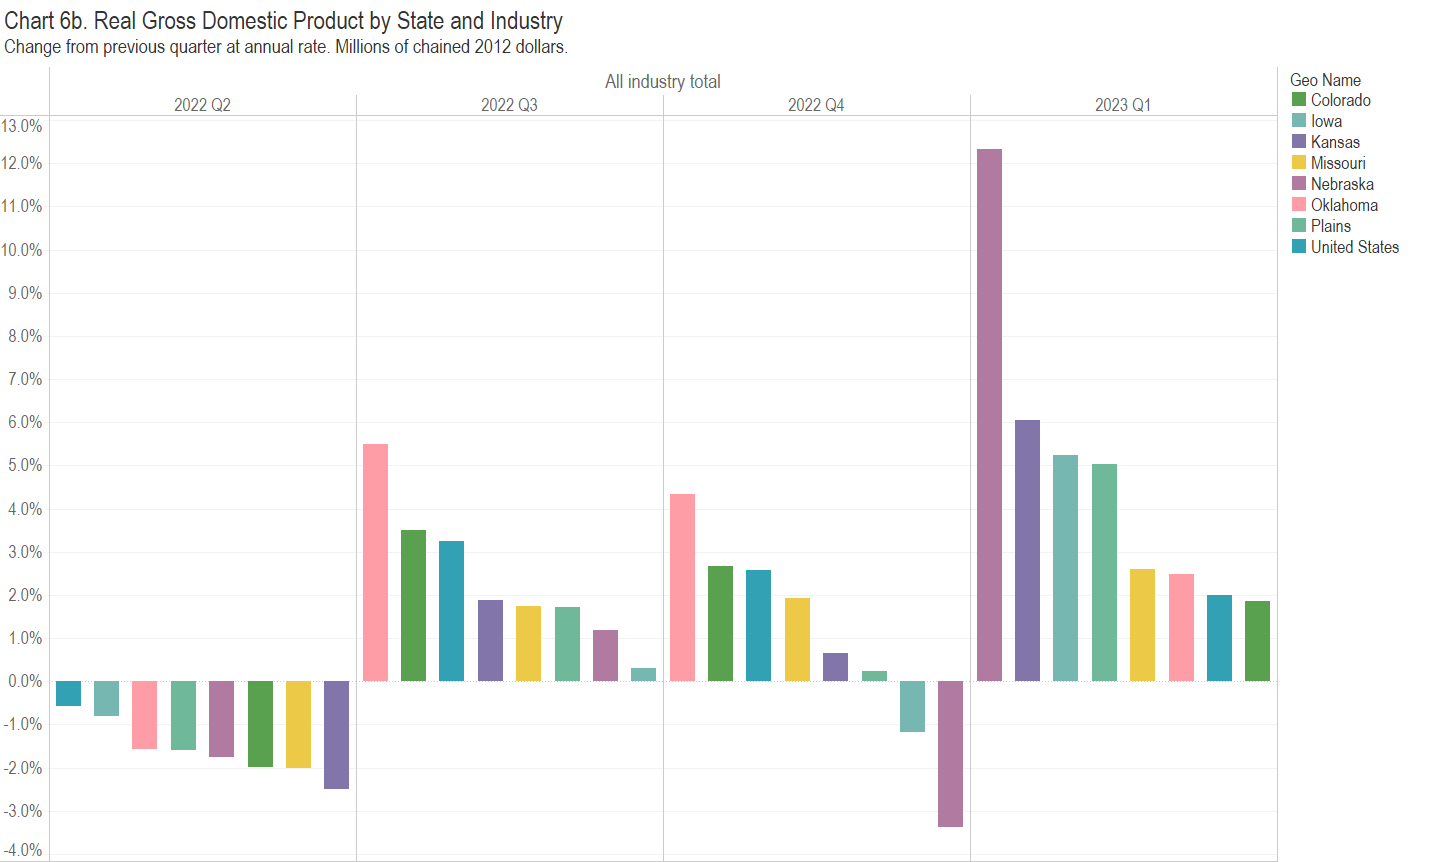
Kansas GDP, First Quarter of 2023
In the first quarter of 2023, the Kansas economy grew at the annual rate of 6.0 percent. Gross Domestic Product rose in all states, with Kansas ranking fourth.
-
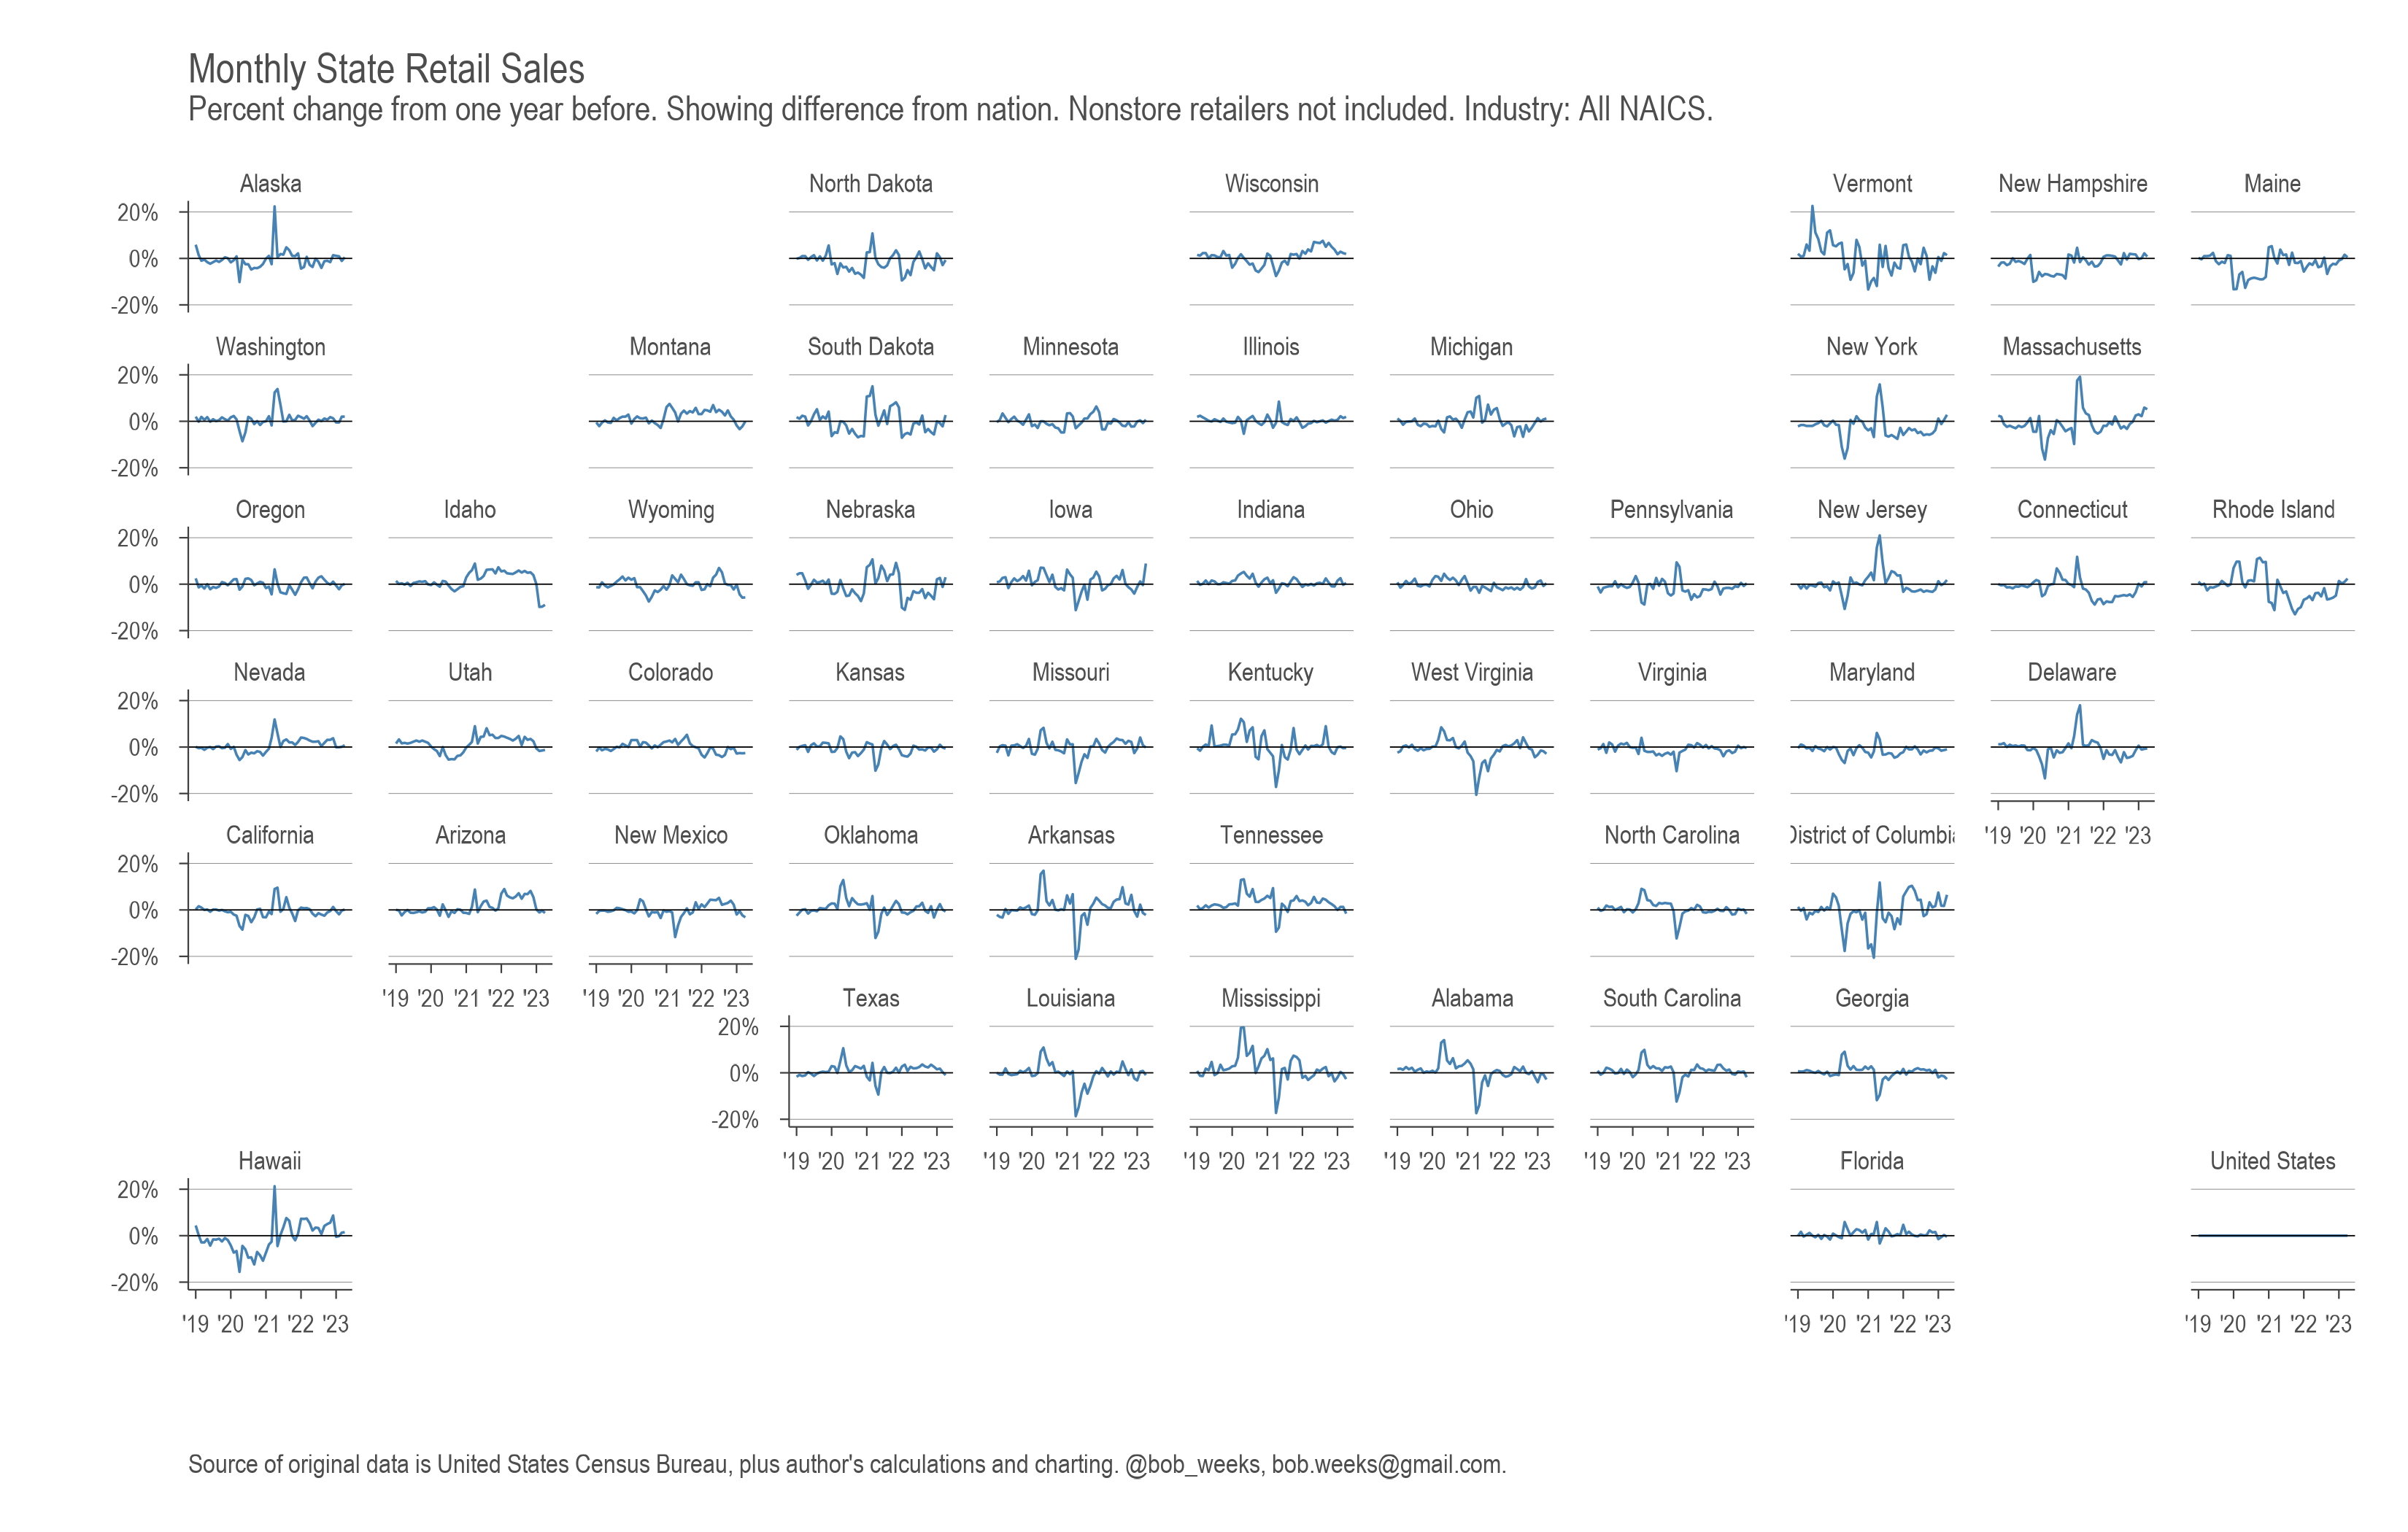
Monthly state retail sales
Monthly retail sales by state and major retail sector, in an interactive visualization.
-
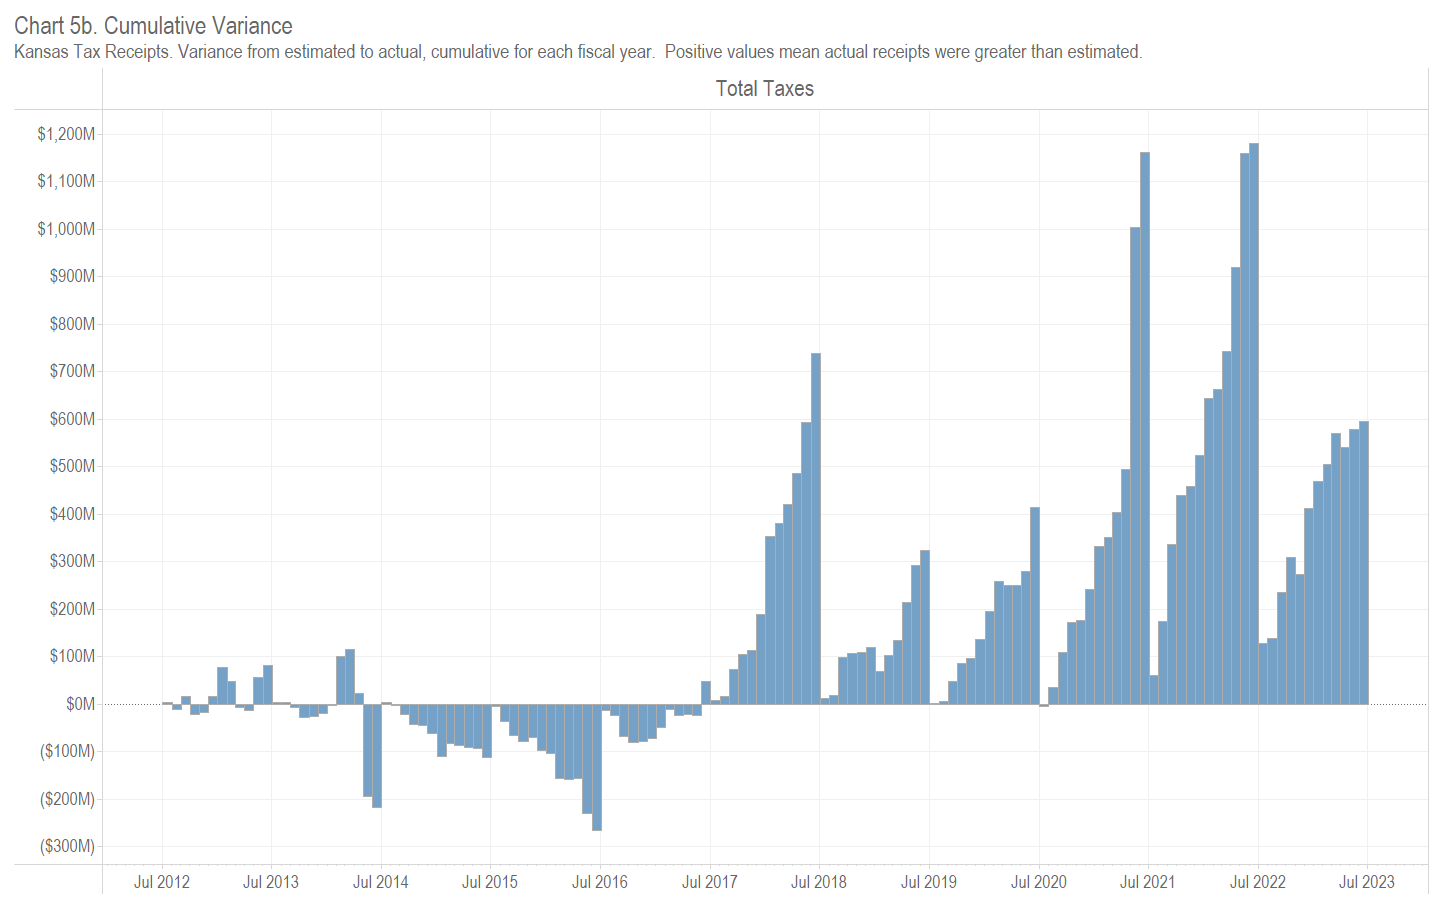
Kansas Tax Revenue, June 2023
For June 2023, Kansas tax revenue was 7.6 percent higher than June 2022, and 41.8 percent more than estimated. Collections for fiscal year 2023 after twelve months are 4.1 percent greater than the prior year.
-

Kansas Tax Revenue, May 2023
For May 2023, Kansas tax revenue was 5.8 percent less than May 2022, and 4.7 percent more than estimated. Collections for fiscal year 2023 after eleven months are 3.8 percent greater than the prior year.
-

Kansas Tax Revenue, April 2023
For April 2023, Kansas tax revenue was 14.7 percent less than April 2022, and 2.3 percent less than estimated. Collections for fiscal year 2023 after ten months are 4.9 percent greater than the prior year.
-
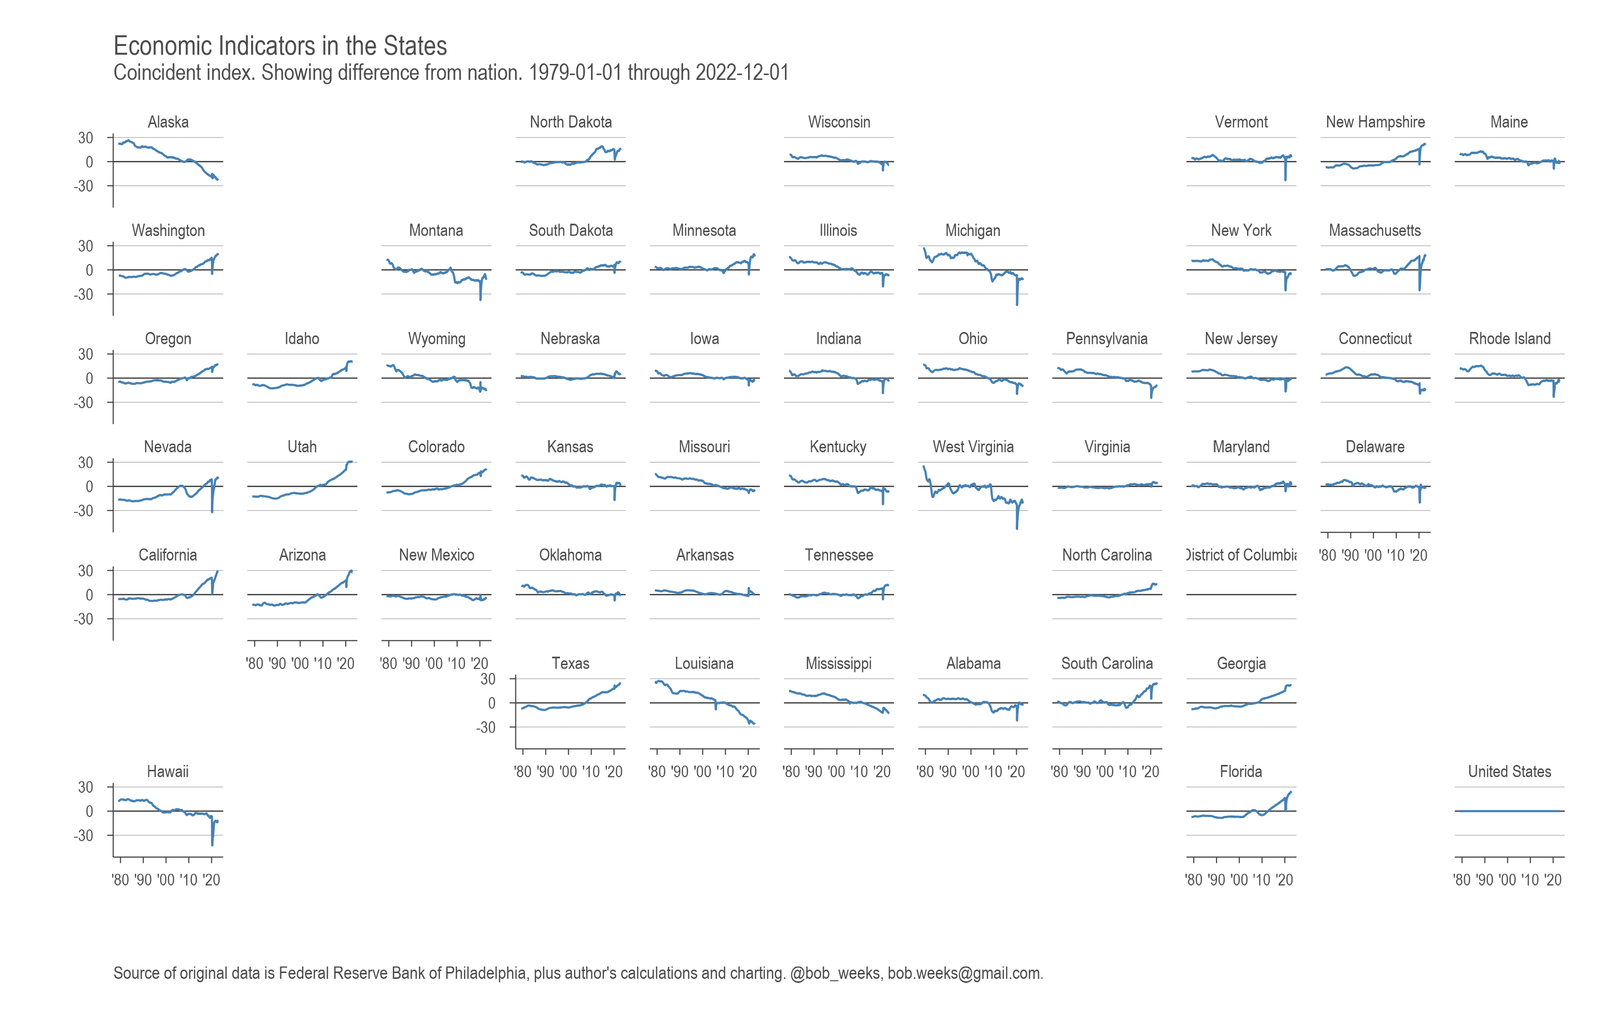
Economic Indicators in the States
A visualization of coincident economic indicators for the states.