Tag: Visualizations

Following are visualizations of data. Many are interactive and created using Tableau Public. In some cases I’ve recorded myself using the visualization to tell a story, and all you have to do is watch.

  • GDP by state and industry

    GDP by state and industry

    An interactive visualization of GDP for each state, by industry.

    The Bureau of Economic Analysis is an agency of the United States Department of Commerce. BEA describes its role as “Along with the Census Bureau, BEA is part of the Department’s Economics and Statistics Administration. BEA produces economic accounts statistics that enable government and business decision-makers, researchers, and the American public to follow and understand the performance of the Nation’s economy. To do this, BEA collects source data, conducts research and analysis, develops and implements estimation methodologies, and disseminates statistics to the public.”

    One series BEA produces is gross domestic product (GDP) by state for 21 industry sectors on a quarterly basis. BEA defines GDP as “the value of the goods and services produced by the nation’s economy less the value of the goods and services used up in production.” It is the value of the final goods and services produced.

    In describing this data, BEA says “These new data provide timely information on how specific industries contribute to accelerations, decelerations, and turning points in economic growth at the state level, including key information about the impact of differences in industry composition across states.” This data series starts in 2005. An announcement of the most recent release of this data is at Gross Domestic Product by State: Third Quarter 2016.

    I’ve gathered the data for this series for all states and regions and present it in an interactive visualization using Tableau Public. The data is presented in real dollars, meaning that BEA adjusted the numbers to account for changes in the price level, or inflation.

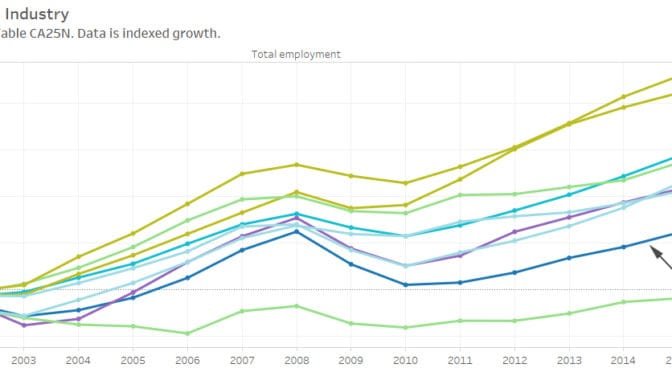
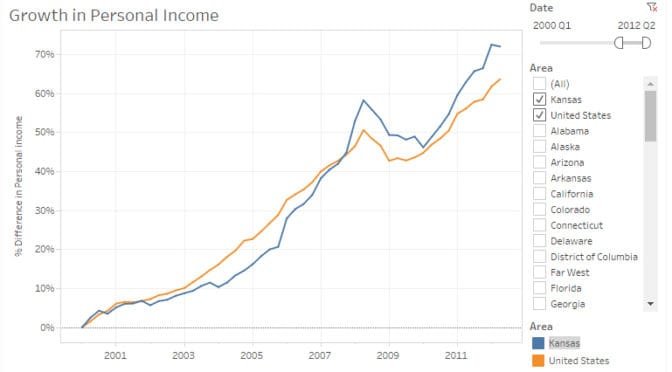
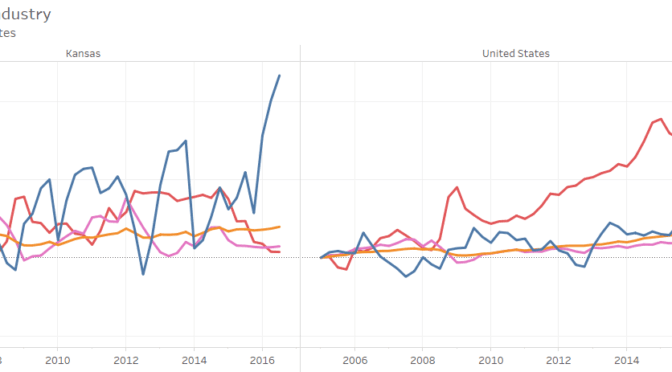
    In the visualization, you may use several different presentations of the data and filter for specific states, industries, and time intervals. Besides a table of values, the series are presented as percentage change over time since the first values, so that growth, rather than magnitude, of GDP is shown.

    Click here to open the visualization.

    Example from the visualization. Click for larger.
  • Kansas school employment

    Kansas school employment

    Kansas school employment rose slightly for the current school year, and ratios of employees to pupils fell, also slightly.

    Kansas school employment. Click for larger.

    Kansas school employment ratios. Click for larger.
    Figures released by the Kansas State Department of Education show the number of certified employees rose slightly for the 2016-2017 school year.

    The number of Pre-K through grade 12 teachers rose to 30,431 from 30,413, an increase of 0.06 percent. Certified employees rose to 41,459 from 41,405, or by 0.13 percent.1 These are not the only employees of school districts.2

    Enrollment fell from 463,504 to 460,491, or 0.61 percent. As a result, the ratios of teachers to students and certified employees to students fell. The pupil-teacher ratio fell from 15.2 pupils per teacher to 15.1. The certified employee-pupil ratio fell from 11.2 to 11.1.

    The relative change in enrollment and employment is not the same in every district. To help Kansas learn about employment trends in individual school districts, I’ve gathered the numbers from the Kansas State Department of Education and present them in an interactive visualization. Click here to use it.

    These figures, at least on a state-wide basis, are contrary to the usual narrative, which is that school employment has been slashed, and class sizes are rising rapidly. The pupil-teacher ratios published by KSDE are not the same statistic as class sizes. But if the data shows that the ratio of pupils to teachers is largely unchanged for the past five years and class sizes are rising at the same time, we’re left to wonder what school districts are doing with teachers.


    Notes

    1. According to KSDE, certified employees include Superintendent, Assoc./Asst. Superintendents, Administrative Assistants, Principals, Assistant Principals, Directors/Supervisors Spec. Ed., Directors/Supervisors of Health, Directors/Supervisors Career/Tech Ed, Instructional Coordinators/Supervisors, All Other Directors/Supervisors, Other Curriculum Specialists, Practical Arts/Career/Tech Ed Teachers, Special Ed. Teachers, Prekindergarten Teachers, Kindergarten Teachers, All Other Teachers, Library Media Specialists, School Counselors, Clinical or School Psychologists, Nurses (RN or NP only), Speech Pathologists, Audiologists, School Social Work Services, and Reading Specialists/Teachers. Teachers include Practical Arts/Vocational Education Teachers, Special Education Teachers, Pre-Kindergarten Teachers, Kindergarten Teachers, Other Teachers, and Reading Specialists/Teachers. See Kansas State Department of Education. Certified Personnel. http://www.ksde.org/Portals/0/School%20Finance/reports_and_publications/Personnel/Certified%20Personnel%20Cover_State%20Totals.pdf.
    2. There are also, according to KSDE, non-certified employees, which are Assistant Superintendents, Business Managers, Business Directors/Coordinators/Supervisors, Other Business Personnel, Maintenance and Operation Directors/Coordinators/Supervisors, Other Maintenance and Operation Personnel, Food Service Directors/Coordinators/Supervisors, Other Food Service Personnel, Transportation Directors/Coordinators/Supervisors, Other Transportation Personnel, Technology Director, Other Technology Personnel, Other Directors/Coordinators/Supervisors, Attendance Services Staff, Library Media Aides, LPN Nurses, Security Officers, Social Services Staff, Regular Education Teacher Aides, Coaching Assistant, Central Administration Clerical Staff, School Administration Clerical Staff, Student Services Clerical Staff, Special Education Paraprofessionals, Parents as Teachers, School Resource Officer, and Others. See Kansas State Department of Education. Non-Certified Personnel Report. http://www.ksde.org/Portals/0/School%20Finance/reports_and_publications/Personnel/NonCertPer%20Cov_St%20Totals.pdf.
  • Kansas school spending, an interactive visualization

    Kansas school spending, an interactive visualization

    An interactive visualization of spending for Kansas school districts.

    The accompanying visualization holds both nominal dollar amounts and amounts adjusted to reflect 2016 dollars. Data includes state aid, local aid, federal aid, and total spending for each school district, both total and per pupil. The visualization includes both tables and charts.

    Kansas school spending, entire state, through 2016. Click for larger. This is an example from the visualization.
    Kansas school spending, entire state, through 2016. Click for larger. This is an example from the visualization.
    For the school year ending in 2016, total spending per pupil was $13,015. This is down from an inflation-adjusted $13,222 for 2015, a decline of 1.56 percent. Considering state funding only, per-pupil funding for 2016 was $8,540, down from an inflation-adjusted $8,631 for 2016, a decline of 1.05 percent.

    In fiscal year 2015 there was a shift in the way property tax revenue is reported, with revenue formerly counted as “local” being counted as “state.” One of the tabs in the visualization shows the sum of local and state values, which eliminates the effect of the change in reporting.

    Kansas Policy Institute has spending data without KPERS (retirement) spending at Non-KPERS funding sets another per-pupil record in 2015-16.

    Spending and revenue data is from Kansas State Department of Education. Inflation-adjusted data calculated using Consumer Price Index, all items, 1982-84=100 (series CUUR0000SA0) from U.S. Bureau of Labor Statistics. The price level used for 2016 is for the first half of 2016. Visualization created using Tableau Public.

    Click here to open the visualization in a new window.

  • Pupil-teacher ratios in the states

    Pupil-teacher ratios in the states

    Kansas ranks near the top of the states in having a low pupil-teacher ratio.

    Pupil-teacher ratios in the states for 2015. Click for larger.
    Data from National Center for Education Statistics, ELSI Elementary and Secondary Information System, shows that Kansas is near the top of the states in pupil-teacher ratio, meaning that Kansas has many teachers compared to the number of students. NCES is a division of the U.S. Department of Education.

    A common complaint in Kansas is that class sizes have been rising. While pupil-teacher ratio is not the same measure as class size, the question is this: If Kansas has a low pupil-teacher ratio, but class sizes are (purportedly) large and rising, what are these teachers doing?

    In the chart of pupil-teacher ratios over time, we see that while the ratio in Kansas rose for the 2015 school year, the trend over time is down, meaning that the number of teachers has increased faster than enrollment. The ratio for 2015 is the same as for 2008, and lower than the years before then.

    Also, note the position of Kansas compared to other states. The pupil-teacher ratio in Kansas is lower than in most states.

    This data is available in an interactive visualization. You may select different views of the data, and filter for specific states and time frames. Click here to access the visualization.

    Pupil-teacher ratios in the states, with Kansas highlighted. Click for larger.
  • Employment by MSA and industry

    Employment by MSA and industry

    An interactive visualization of employment in metropolitan areas.

    Employment data from the Bureau of Economic Analysis, an agency of the United States Department of Commerce, is available for all metropolitan areas and major industries. I present this data in an interactive visualization using Tableau Public. In this visualization you may access several different presentations of the data. You may filter for specific areas, industries, and time periods. The data is available in a table of employment numbers, or in series presented as the percentage change since the first value. This illustrates relative growth, rather than magnitude, of employment. This is annual data from BEA table CA25N1 through 2015, the last year available at this time.

    In the nearby example from the visualization we can see that Wichita has performed poorly compared to some peers of interest.

    You may use the visualization yourself by clicking here.

    Of note, the definitions of MSAs change from time to time.2

    Employment by MSA and Industry example. Click for larger.


    Notes

    1. Bureau of Economic Analysis. Regional Economic Accounts. https://www.bea.gov/regional/.
    2. Broomfield County, CO, was created from parts of Adams, Boulder, Jefferson, and Weld counties effective November 15, 2001. Estimates for Broomfield county begin with 2002.
      Estimates from 2008 forward separate Skagway-Hoonah-Angoon Census Area into Skagway Municipality and Hoonah-Angoon Census Area. Estimates from 2009 forward separate Wrangell-Petersburg Census Area into Petersburg Census Area and Wrangell City and Borough. In addition, a part of the Prince of Wales-Outer Ketchikan Census Area was annexed by Ketchikan Gateway Borough and part (Meyers Chuck Area) was included in the new Wrangell City and Borough. The remainder of the Prince of Wales-Outer Ketchikan Census Area was renamed Prince of Wales-Hyder Census Area. Petersburg Borough was created from part of former Petersburg Census Area and part of Hoonah-Angoon Census Area for 2013 forward. Prince of Wales-Hyder Census Area added part of the former Petersburg Census Area beginning in 2013. For years 2009-2012, Petersburg Borough reflects the geographic boundaries of the former Petersburg Census Area. Wade Hampton Census Area was renamed Kusilvak Census Area on July 1, 2015.
      Virginia combination areas consist of one or two independent cities with 1980 populations of less than 100,000 combined with an adjacent county. The county name appears first, followed by the city name(s). Separate estimates for the jurisdictions making up the combination area are not available. Bedford County, VA includes the independent city of Bedford for all years.
      Shannon County, SD was renamed to Oglala Lakota County, SD on May 1, 2015.
      Nonmetropolitan portion includes micropolitan counties.
  • Kansas school employees by type

    Kansas school employees by type

    An interactive visualization of relative trends in Kansas school employment.

    Kansas State Department of Education makes available tables of the number of employees working in Kansas schools. Employees are classified in two broad categories, Certified and Non-Certified. Within each category, employees are further classified by job type such as Superintendent, Curriculum Specialist, and Social Worker.

    Example from the visualization, showing assistant superintendents highlighted. Click for larger.
    I’ve gathered the tables back to fiscal year 2002 (the 2001 — 2002 school year) and present them in an interactive visualization. There are separate visualizations for Certified and Non-Certified employees. In each, as shown in the instruction, you may check the check boxes to add or remove types of employees. For the employee types that are shown, you may click to highlight types apart from the others.

    The line charts show the relative change in the number of employees. You may learn whether the number of employee type A is growing faster or slower than employee type B.

    The visualization also holds tables showing the number of employees.

    Click here to open the visualization in a new window.

    Using the visualization.
    Using the visualization.
  • Spending in the States

    Spending in the States

    The National Association of State Budget Officers publishes spending data for the states. In this interactive visualization, I present the data in a graphical and flexible format.

    Data for each state is subdivided by fund (see below for definitions). Data through 2015 is actual, while data for fiscal year 2016 is estimated. The figures for the state “United States” were computed by summing the spending in all states, then dividing by the U.S. population. These figures are not adjusted for inflation.

    Of note is the tab comparing spending in states that have an income tax vs. those that have no income tax.

    Click here to access the visualization.

    Example from the visualization. Click for larger.
    Example from the visualization. Click for larger.

    From NASBO, definitions of the funds.

    General Fund: The predominant fund for financing a state’s operations. Revenues are received from broad-based state taxes. However, there are differences in how specific functions are financed from state to state.

    Federal Funds: Funds received directly from the federal government.

    Other State Funds: Expenditures from revenue sources that are restricted by law for particular governmental functions or activities. For example, a gasoline tax dedicated to a highway trust fund would appear in the “Other State Funds” column. For higher education, other state funds can include tuition and fees. For Medicaid, other state funds include provider taxes, fees, donations, assessments, and local funds.

    Bonds: Expenditures from the sale of bonds, generally for capital projects.

    State Funds: General funds plus other state fund spending, excluding state spending from bonds.

  • Airport traffic statistics

    Airport traffic statistics

    Airport traffic data presented in an interactive visualization.

    Example from the visualization, showing Wichita compared to all airports. Click for larger.
    Example from the visualization, showing Wichita compared to all airports. Click for larger.
    The source of this data is TranStats, a service of the Bureau of Transportation Statistics, specifically table T-100 Domestic Segment (U.S. Carriers). TranStats describes the table: “This table contains domestic non-stop segment data reported by U.S. air carriers, including carrier, origin, destination, aircraft type and service class for transported passengers, freight and mail, available capacity, scheduled departures, departures performed, aircraft hours, and load factor when both origin and destination airports are located within the boundaries of the United States and its territories.”

    This data is produced monthly, but this visualization holds data only through the complete year 2015. Visualization created by the author using Tableau Public.

    To view the most recent version of this visualization, click here.

  • Personal income in the states

    Personal income in the states

    An interactive visualization of personal income growth and change in the states.

    An updated version of a smiliar visualization is here.

    The Bureau of Economic Analysis, an agency of the United States Department of Commerce, collects and analyses data regarding the U.S. and world economies. One series is personal income, defined by BEA as “Personal income is the income received by, or on behalf of, all persons from all sources: from participation as laborers in production, from owning a home or business, from the ownership of financial assets, and from government and business in the form of transfers. It includes income from domestic sources as well as the rest of world. It does not include realized or unrealized capital gains or losses.”

    This interactive visualization presents personal income data from BEA. Data is subdivided by state, along with regions and the entire country. There are four views of data. Some work best with just two or three states, while others can show many states. You may choose a range of dates (this data is quarterly). Also, select one or more states or regions. Click on the legend to highlight one or more series.

    Click here to use the visualization.

    Example from the visualization, showing Kansas and the United States. Click for larger.
    Example from the visualization, showing Kansas and the United States. Click for larger.