Tag: Wichita city government
-
Naftzger Park public hearing to be considered
The Wichita City Council may set August 15, 2017 as the date for a public hearing on the future of Naftzger Park in downtown Wichita.
-
Wichita WaterWalk agreement not followed
Does the City of Wichita enforce its public-private partnership agreements? In some cases the city doesn’t even ask for the information that is needed for enforcement.
-
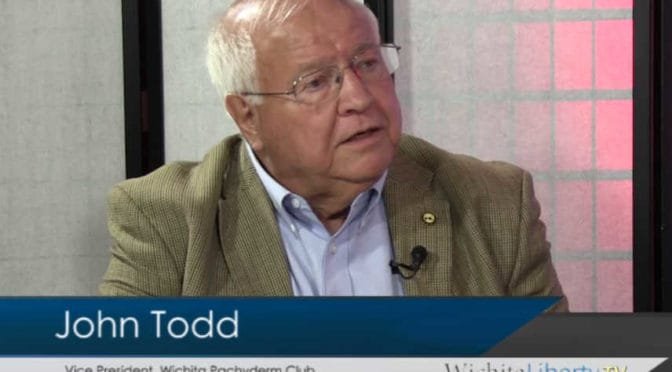
WichitaLiberty.TV: John Todd and Wichita issues
John Todd joins Bob Weeks and Karl Peterjohn to discuss issues involving the City of Wichita, including the future of Naftzger Park and economic development.
-
From Pachyderm: Wichita city council candidates
From the Wichita Pachyderm Club this week: Wichita City Council Primary and General Election Candidates. This audio presentation was recorded June 30, 2017.
-

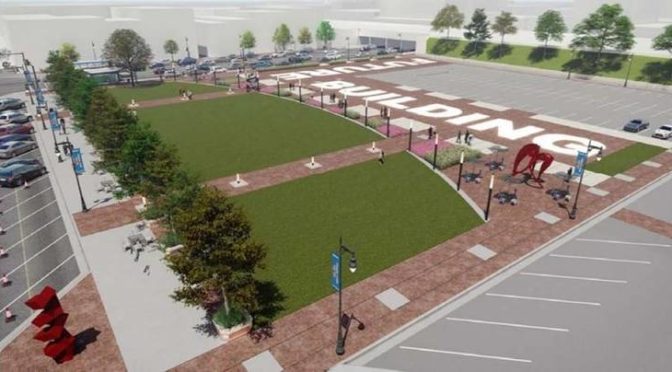
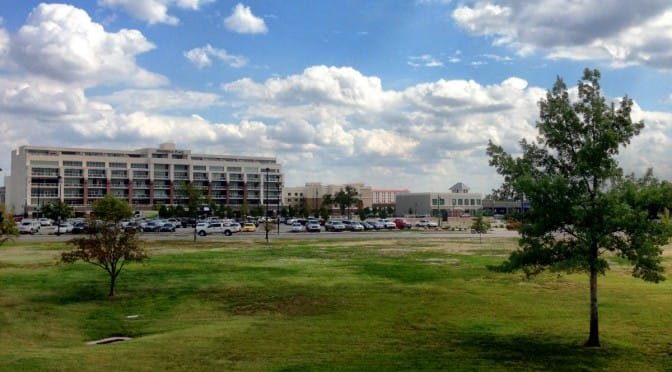
Naftzger Park in Downtown Wichita
An information resource regarding the future of Naftzger Park in downtown Wichita.
-
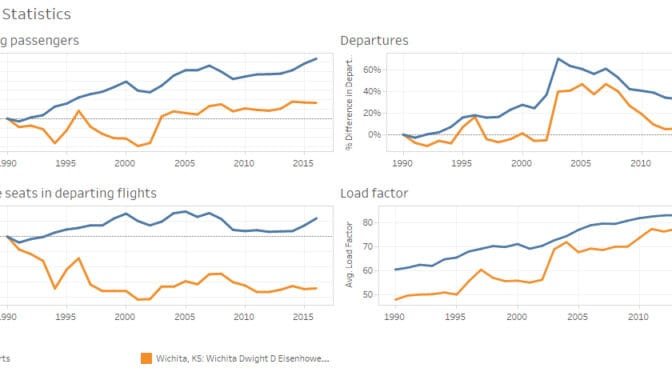
Airport traffic statistics, 2016
Airport traffic data presented in an interactive visualization, updated through 2016.
-

Wichita, Kansas, and U.S. economic dashboards
Dashboards of economic indicators for Wichita and Kansas, compared to the United States.
-

Metro Monitor for the Wichita economy
A research project by The Brookings Institution illustrates the performance of the Wichita-area economy.
-
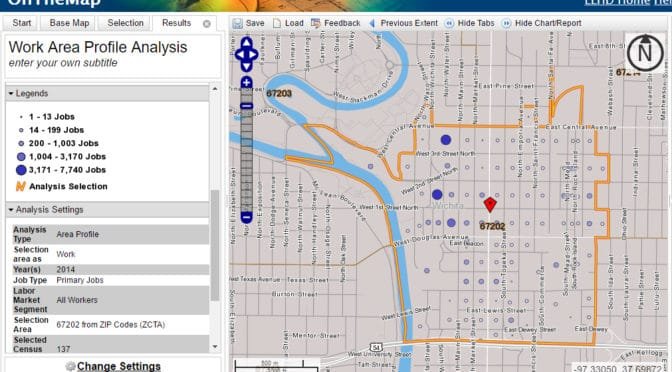
Census data for downtown Wichita workers
Is the presentation of the number of workers in downtown Wichita an innocent mistake, mere incompetence, or a willful lie?
-
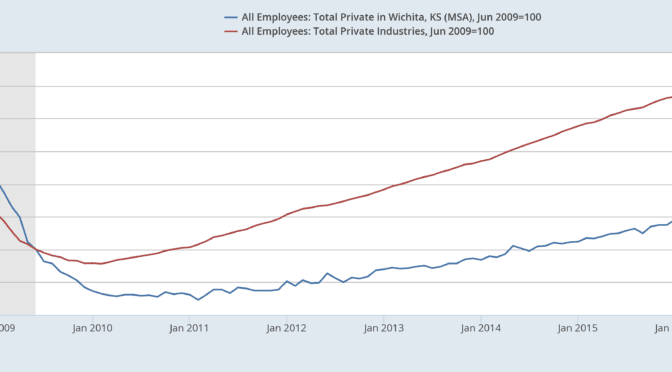
Wichita post-recession job growth
Wichita has recovered from recessions, but after the most recent, the city is falling further behind.
-
As Wichita considers new ventures, a look back at some data
The City of Wichita will soon be flooded with data regarding downtown convention and performing arts facilities. Past experience should warn us to be skeptical.
-
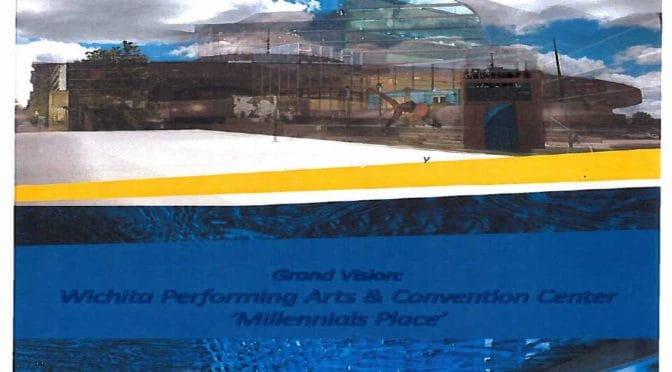
Wichita about to commit to more spending. Bigly.
This week the Wichita City Council considers hiring a consulting firm to develop plans for a new performing arts and convention center.