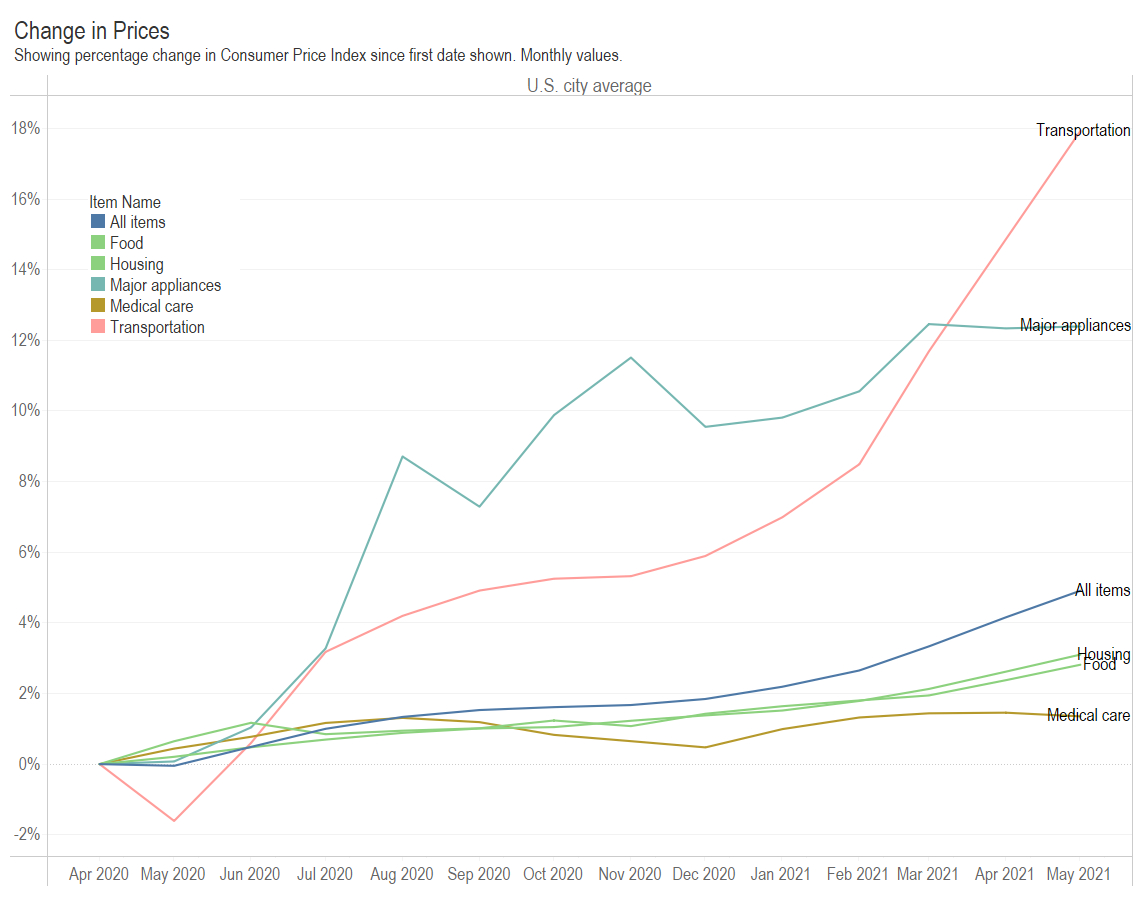
The Consumer Price Index is the most widely used measure of inflation. This interactive visualization presents CPI data.
Inflation — an increase in prices — is captured by the Consumer Price Index. It is computed using a market basked “developed from detailed expenditure information provided by families and individuals on what they actually bought.” (1)Consumer Price Index Frequently Asked Questions. Available at https://www.bls.gov/cpi/questions-and-answers.htm.
The Bureau of Labor Statistics, part of the United States Department of Labor, maintains the index. The page at BLS for this data is Consumer Price Index.

This visualization is a work in progress. There are over four thousand series, and presenting them in an organized fashion is a challenge.
This visualization holds monthly values. For the charts, you may select one area at a time. The most commonly-used series is the U.S. City Average.
The tabs for Series, Items, Areas, and Periods hold tables describing data that BLS provides.
As of 2018, the CPI now has two size classes, A and B/C (corresponding to population size greater than 2,500,000 for size class A and 2,500,000 or less for size class B/C), rather than the three size classes under the old design (A, B/C, and D, with population size of more than 1,500,000 for size class A, 50,000 to 1,500,000 for size class B/C, and less than 50,000 for size class D). The current size class B/C and size class D are consolidated in order to reduce small sample bias and to reduce the standard error of indexes.
To access this interactive visualization, click here.
For more visualizations, click here.

References
| ↑1 | Consumer Price Index Frequently Asked Questions. Available at https://www.bls.gov/cpi/questions-and-answers.htm. |
|---|
