Category: Economics
-
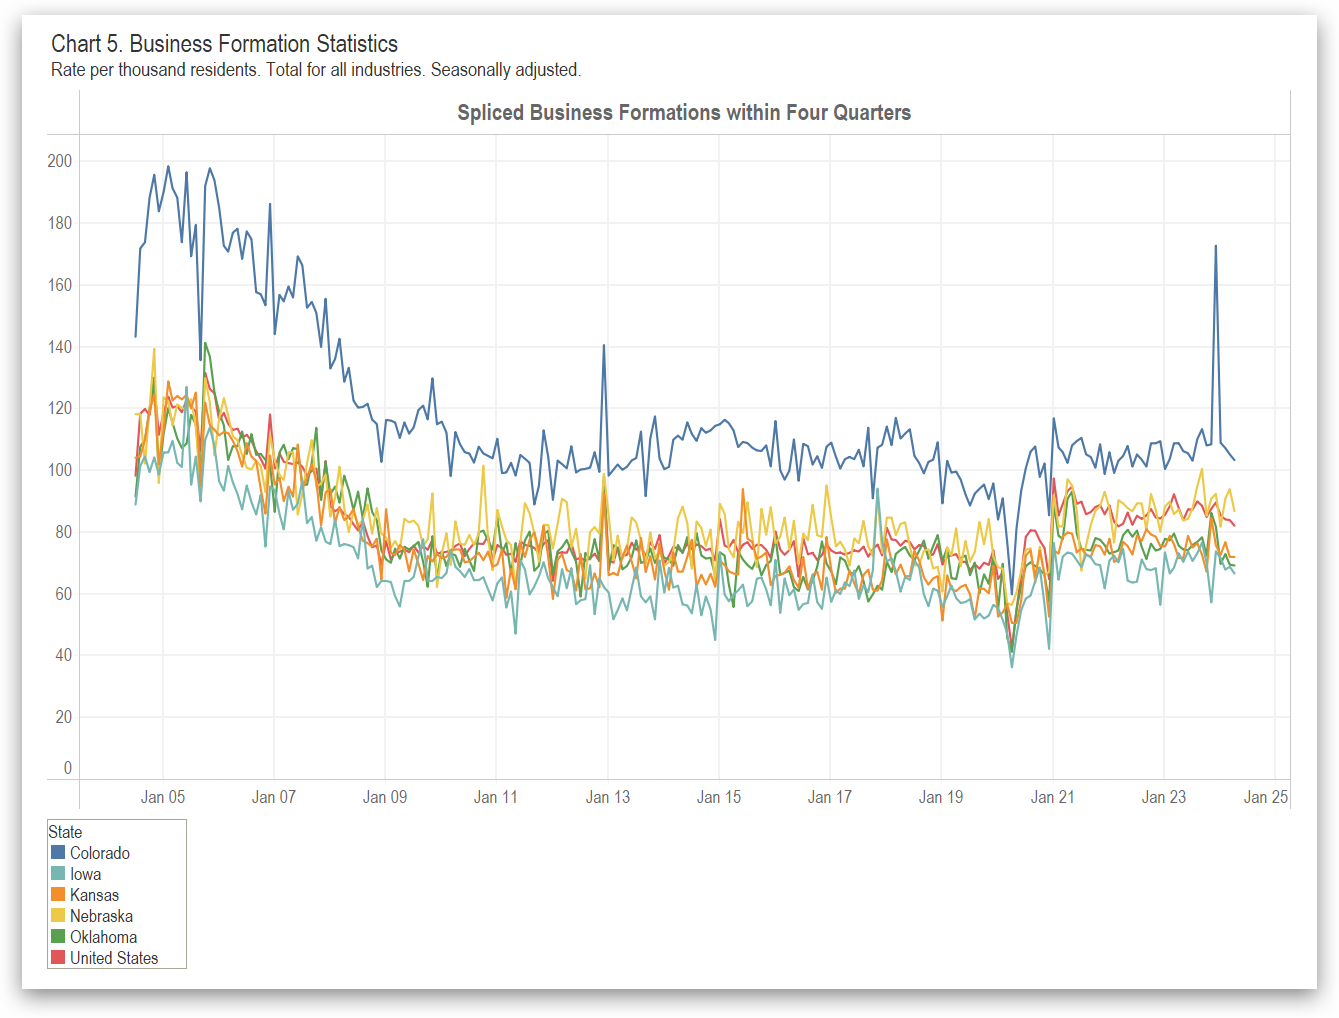
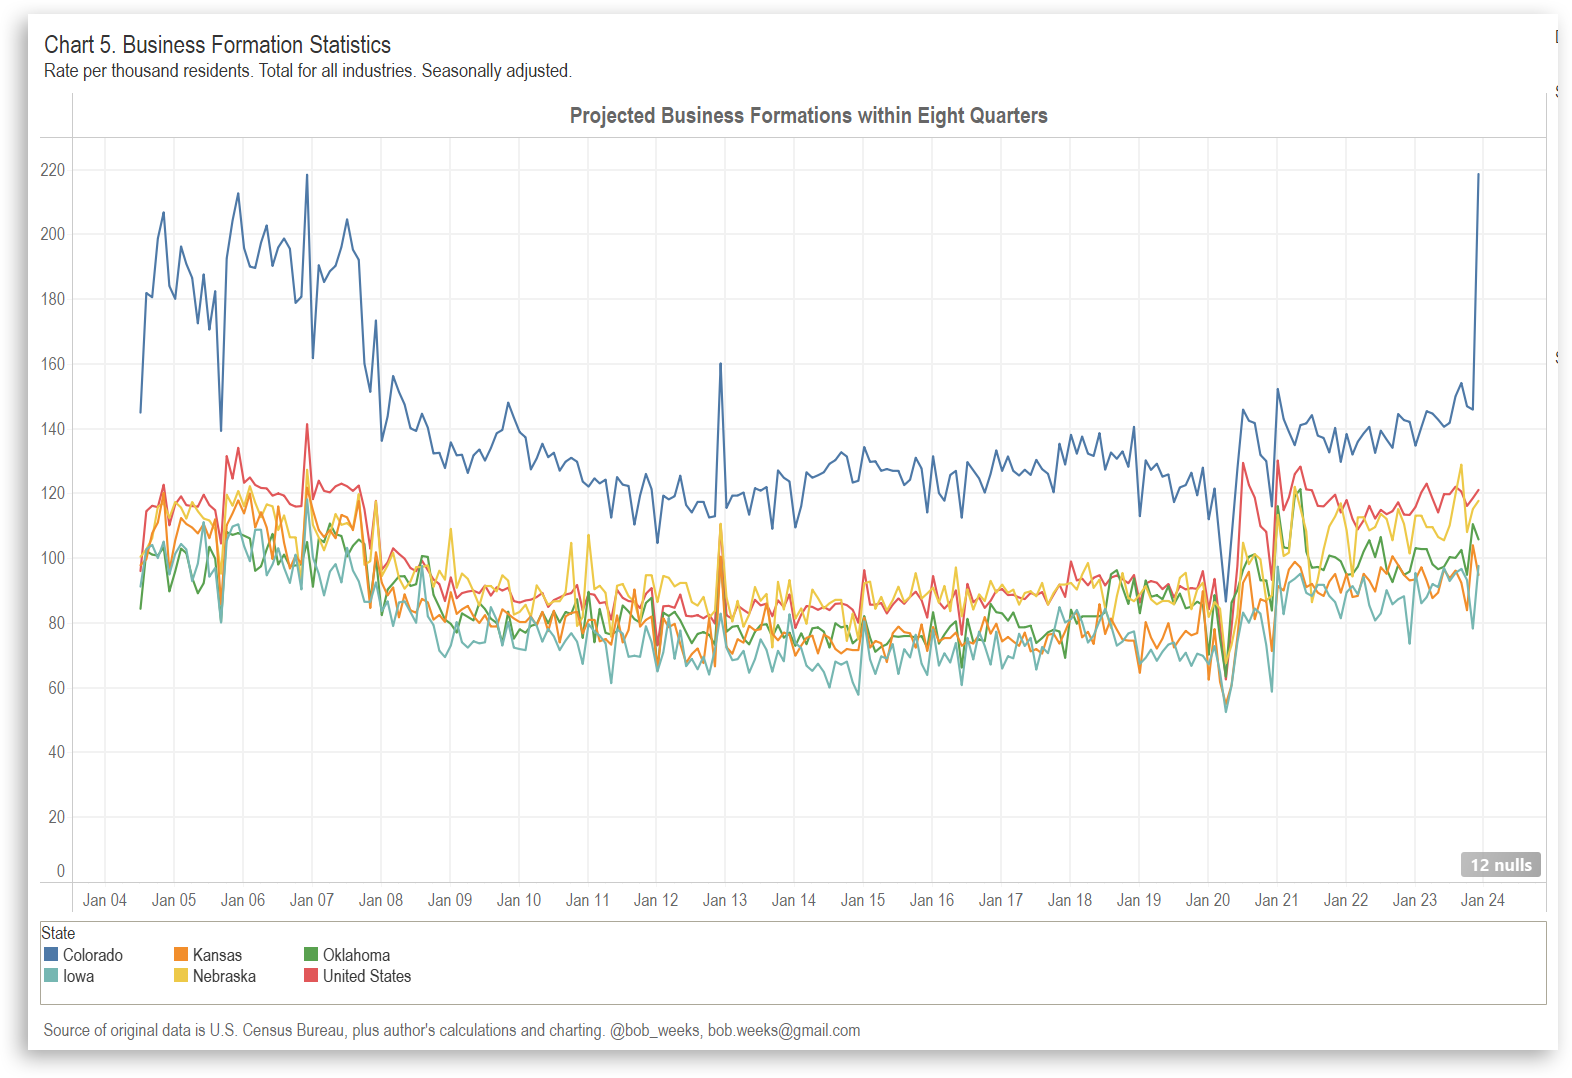
Business Formation in States
For both business applications and business formations, Kansas does better than some states, but lags many states and the nation.
-
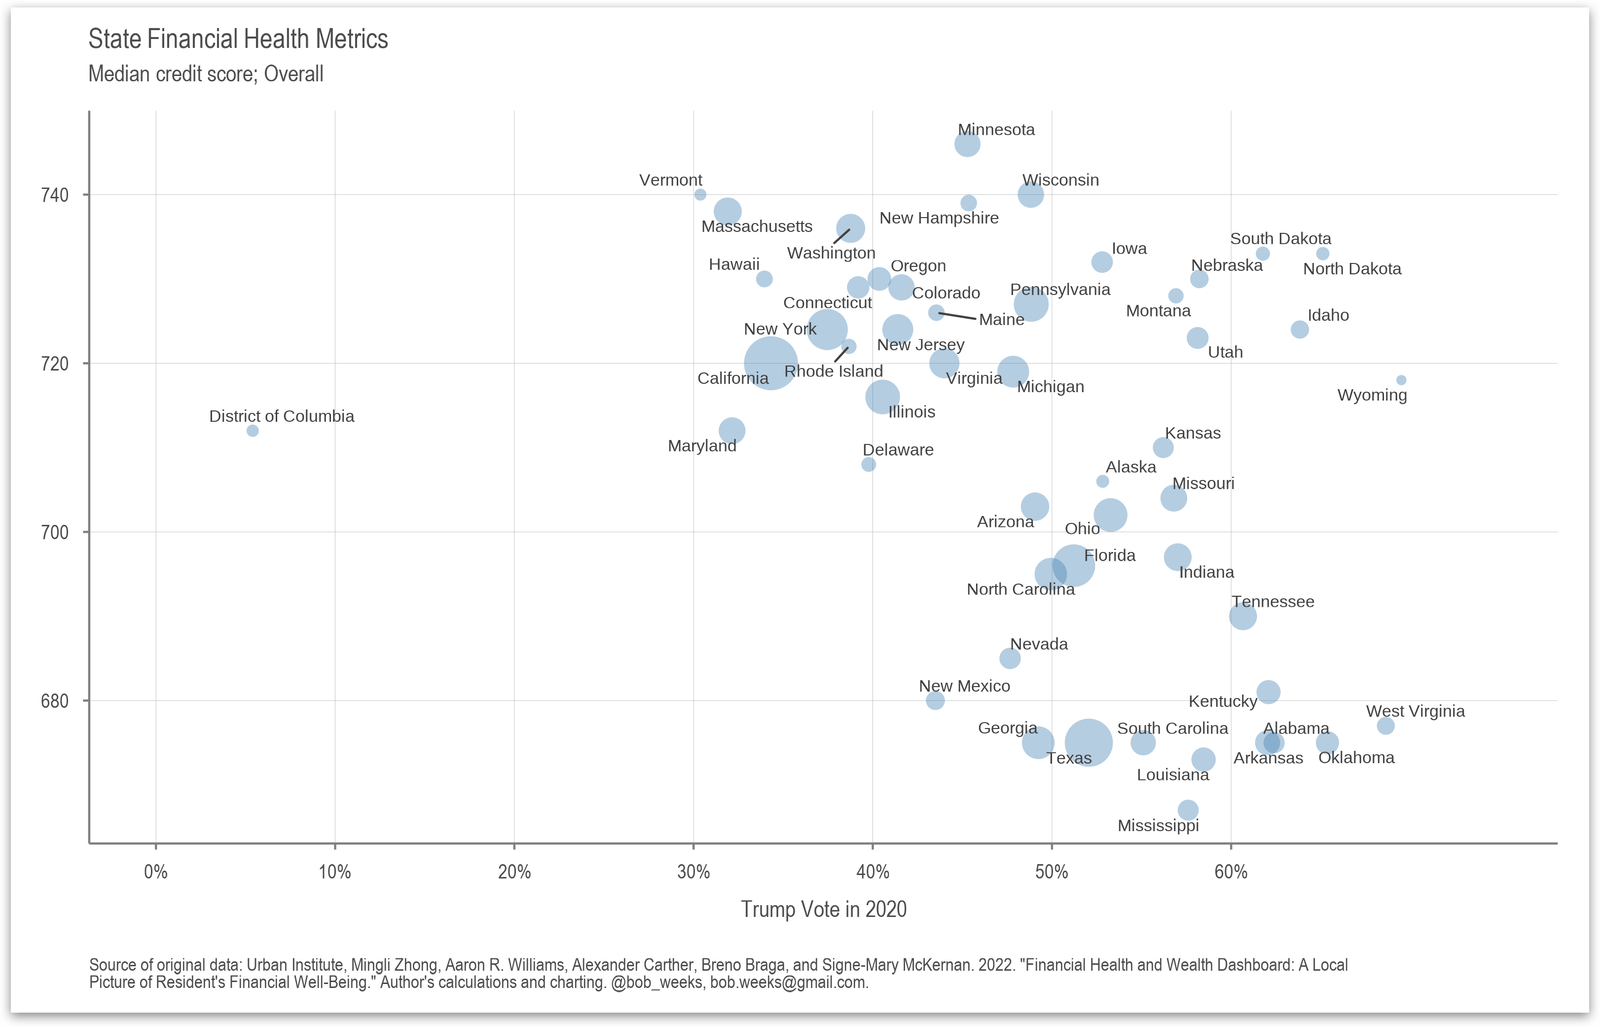
State Financial Health Metrics: Credit Score
This chart shows the relationship between the median credit scores of residents in each U.S. state and the percentage of votes that Donald Trump received in the 2020 election.
-
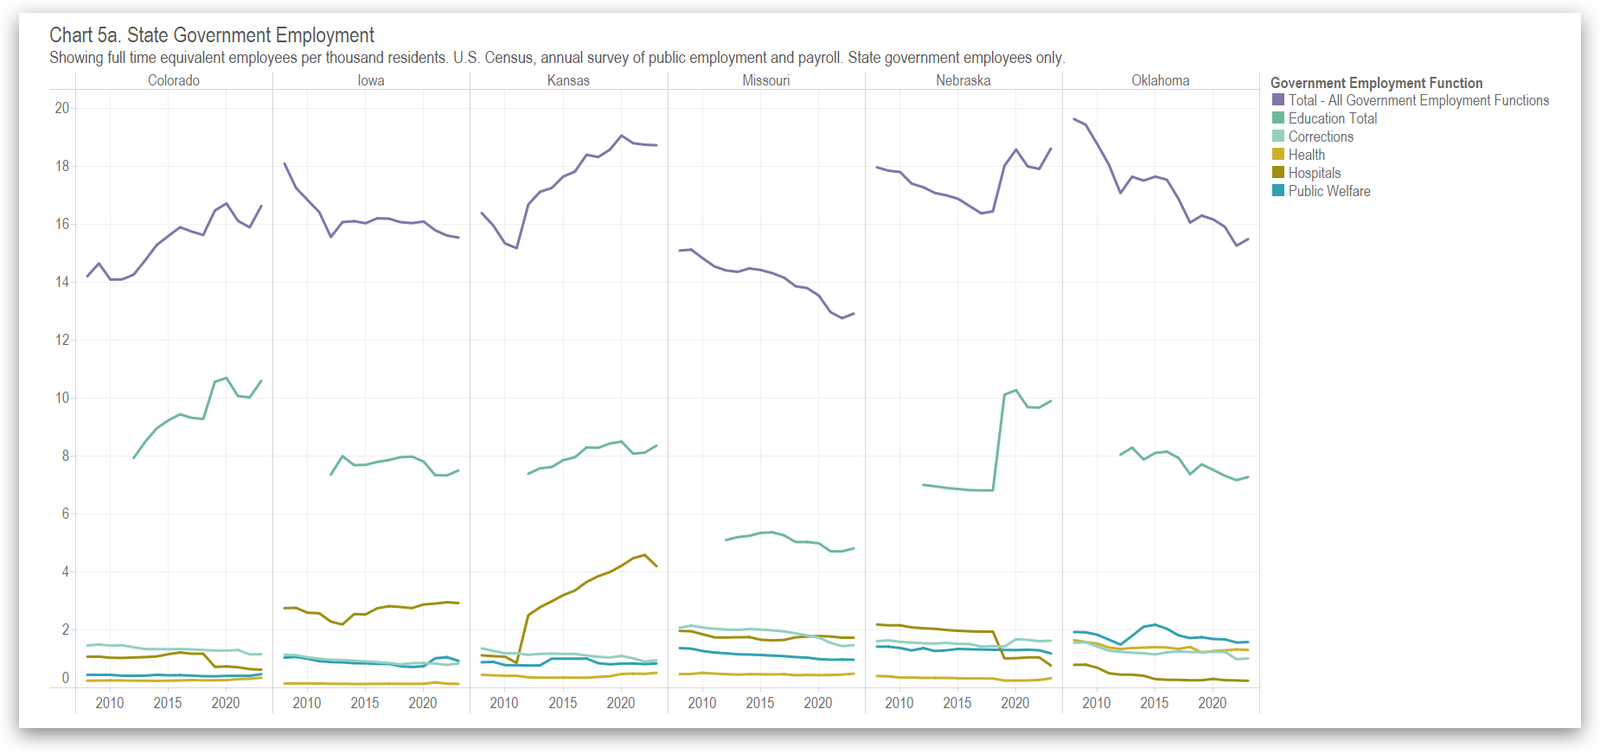
State Government Employees in Kansas and the States
Kansas has more state government employees per resident than most states. The trend is steady after rising.
-

Cost of Living from 1958 to 2024
A meme popular on social media is only a starting point in understanding our economy.
-
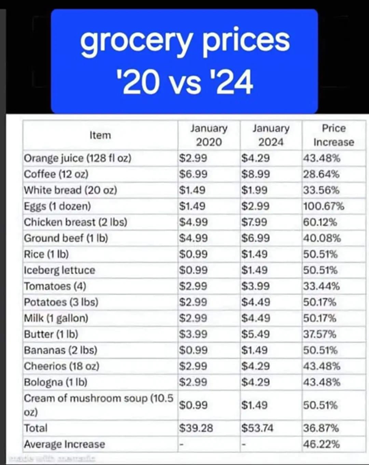
Inflation Meme
A popular meme on social media contains serious mistakes and should be ignored.
-
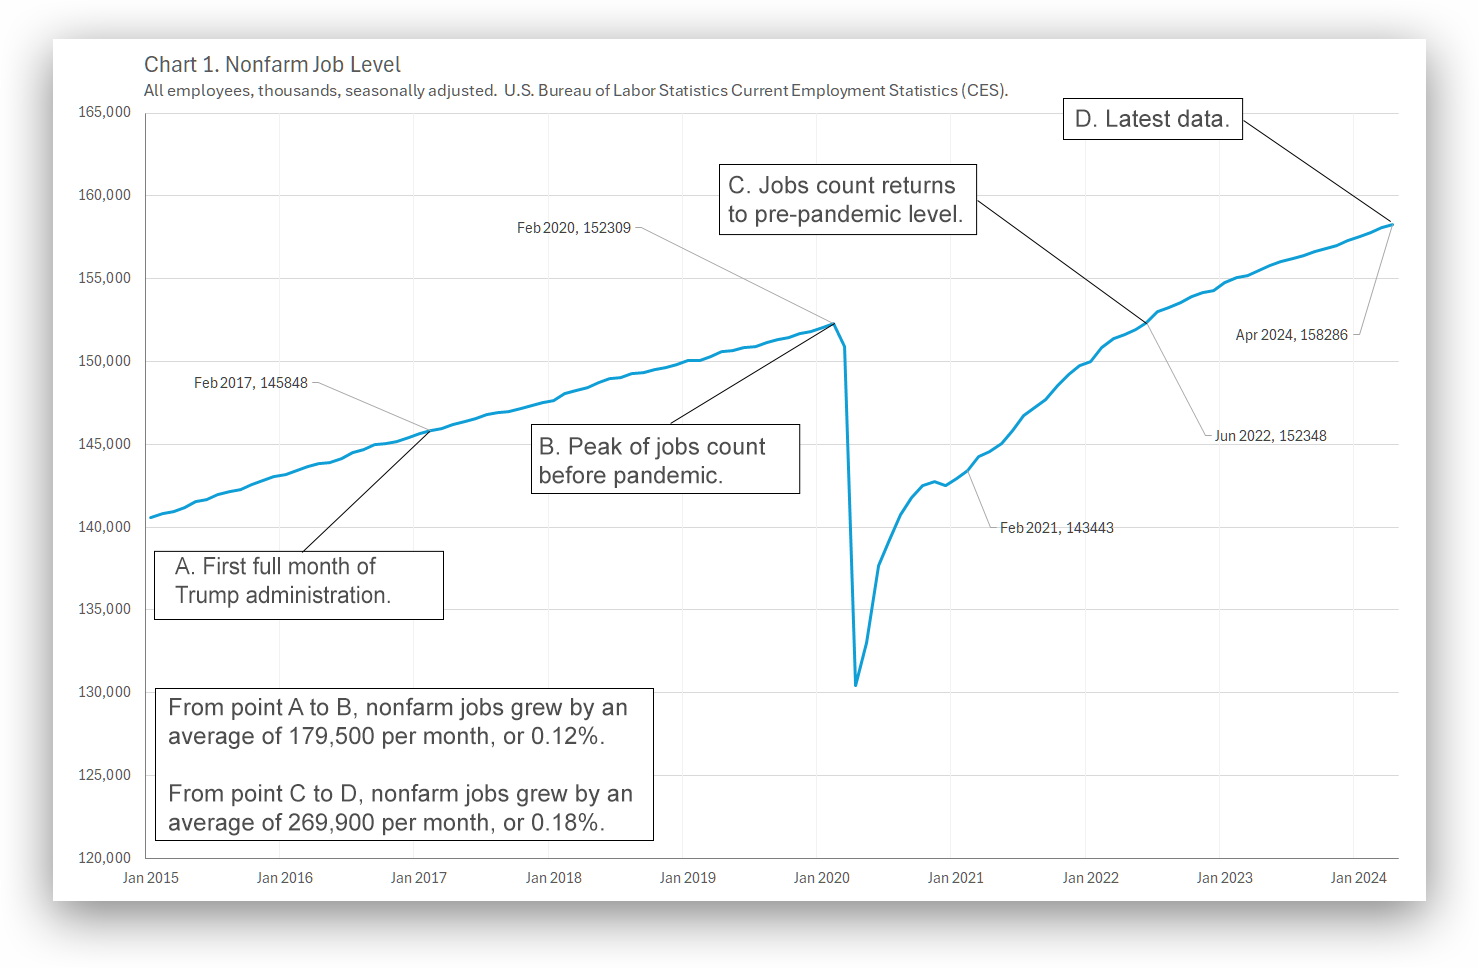
Employment, pre- and post-Covid
Comparing job growth before and after the Covid pandemic, attempting to remove the effect of the pandemic.
-
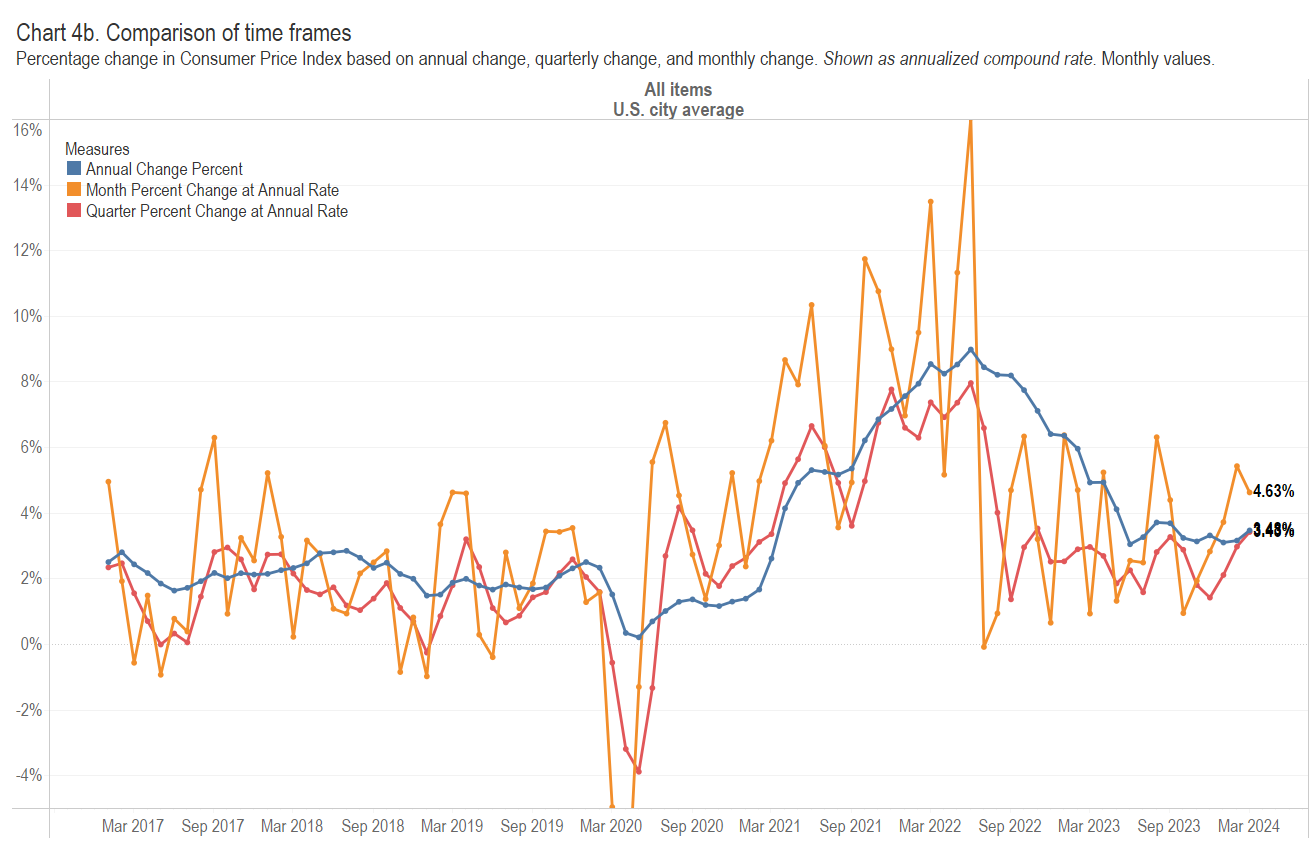
Consumer Price Index, March 2024
Looking at inflation calculations in a different way.
-
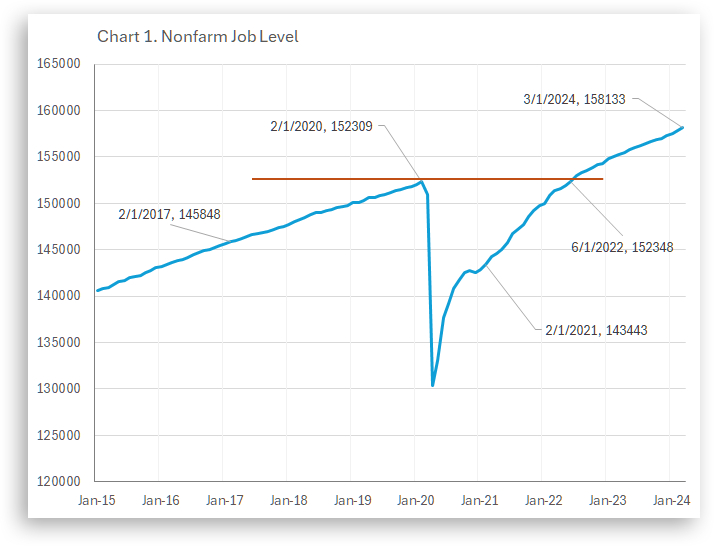
Employment, pre- and post-Covid
Comparing job growth before and after the Covid pandemic, attempting to remove the effect of the pandemic.
-
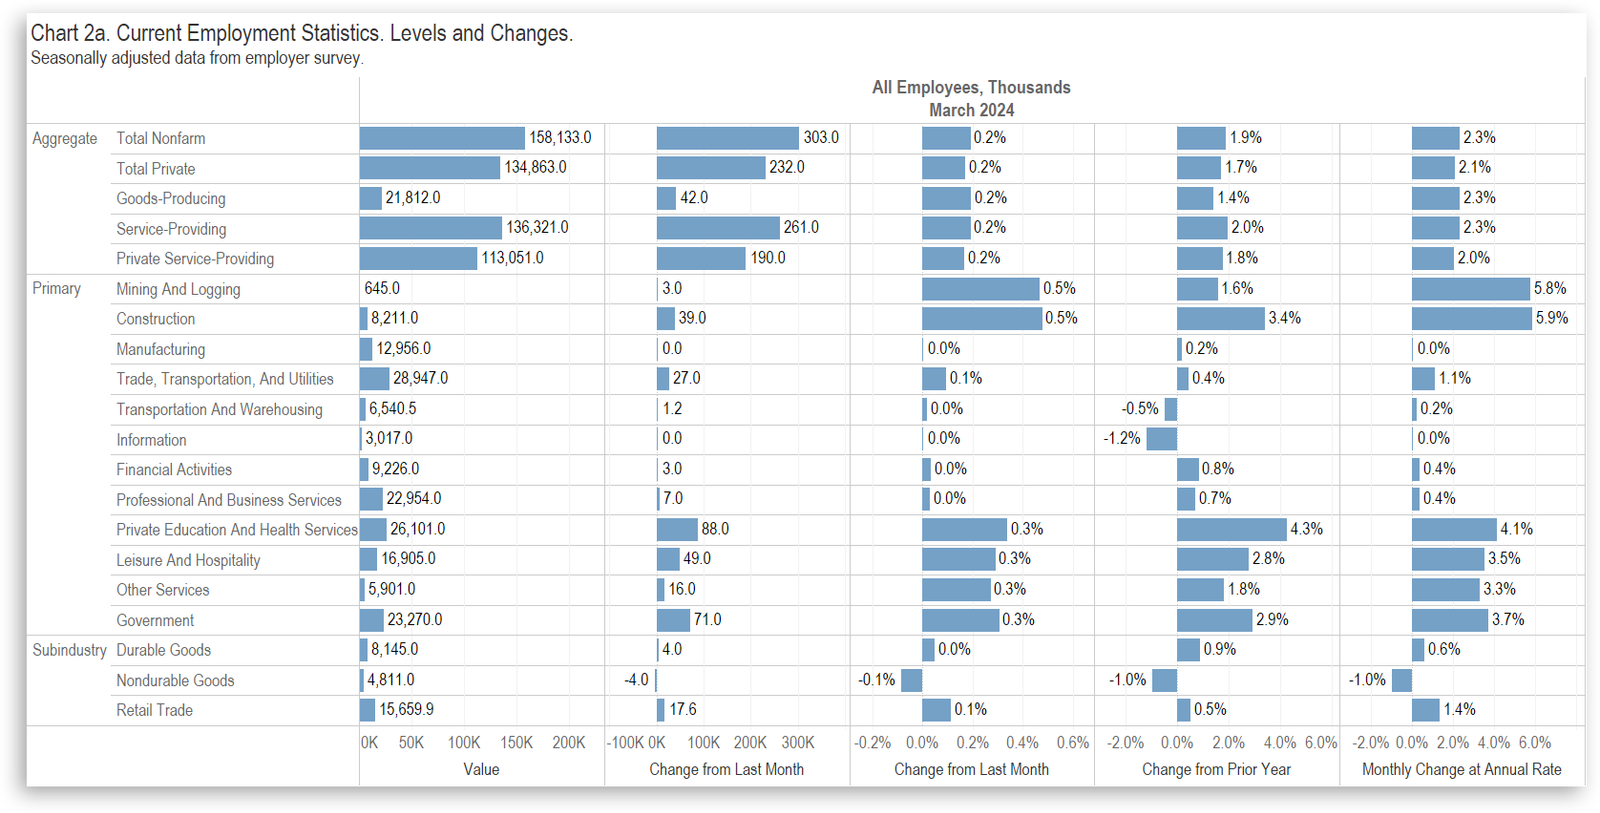
National Employment Situation, March 2024
Total nonfarm payroll employment increased by 333,000 in March 2024 from February 2024. The unemployment rate fell from 3.9 percent to 3.8 percent.
-
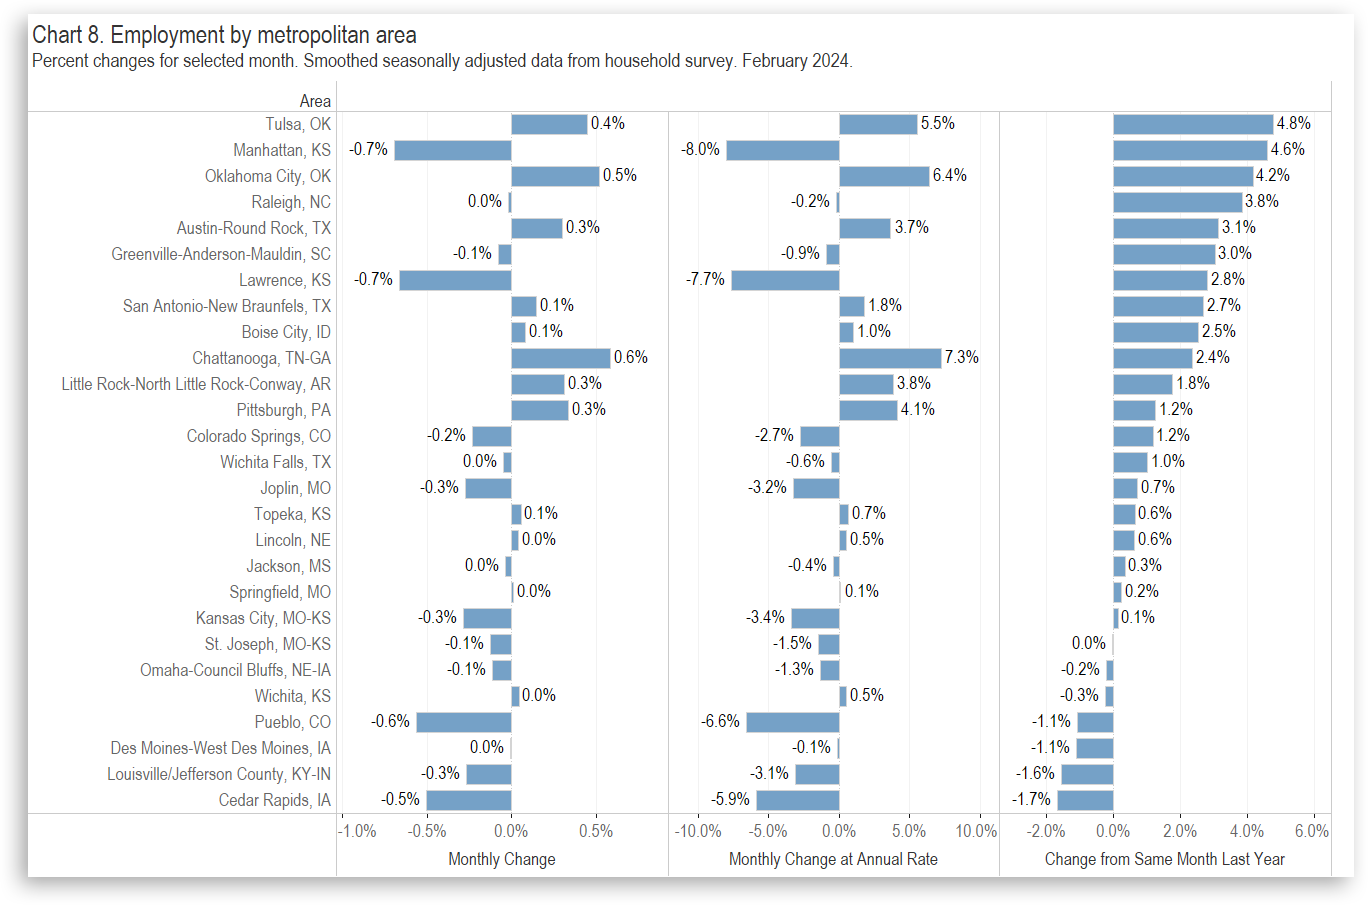
Wichita Employment Situation, February 2024
For the Wichita metropolitan area in February 2024, most employment indicators changed only slightly from the prior month, and the unemployment rate did not change. Wichita continues to perform poorly compared to its peers.
-
Business Formation in States
For both business applications and business formations, Kansas does better than some states, but lags many states and the nation.
-
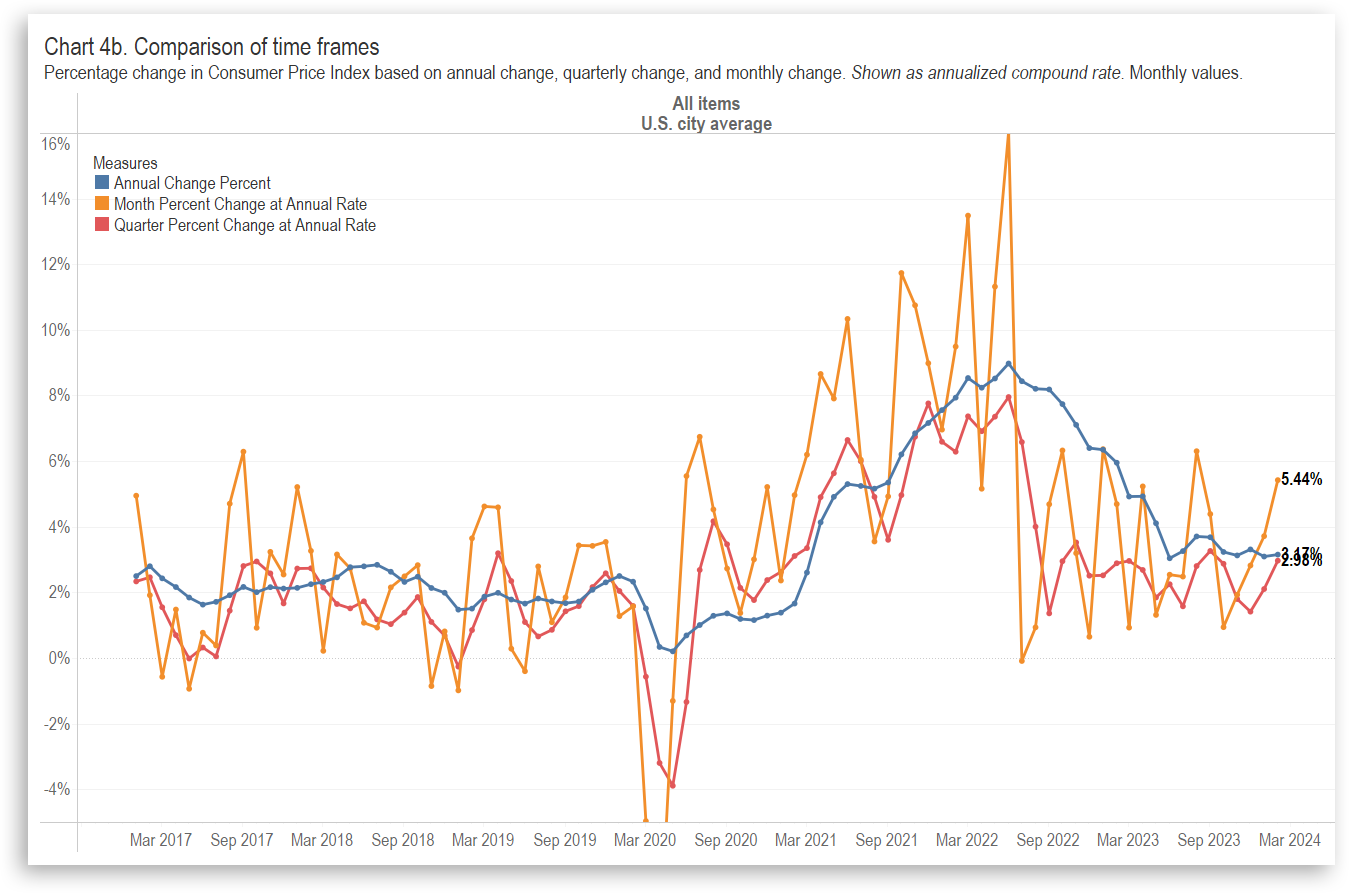
Consumer Price Index, February 2024
Looking at inflation calculations in a different way.