-

Updated: Century II resource center
Read more: Updated: Century II resource centerThe Century II resource center has been updated with documents and news stories.
-

Updated: Economic indicators in the states
Read more: Updated: Economic indicators in the statesEconomic indicators in the states, an interactive visualization.
-

Added to presidential data explorer: Economic indexes
Read more: Added to presidential data explorer: Economic indexesExplore the economic record of presidents through the lens of two economic indexes.
-
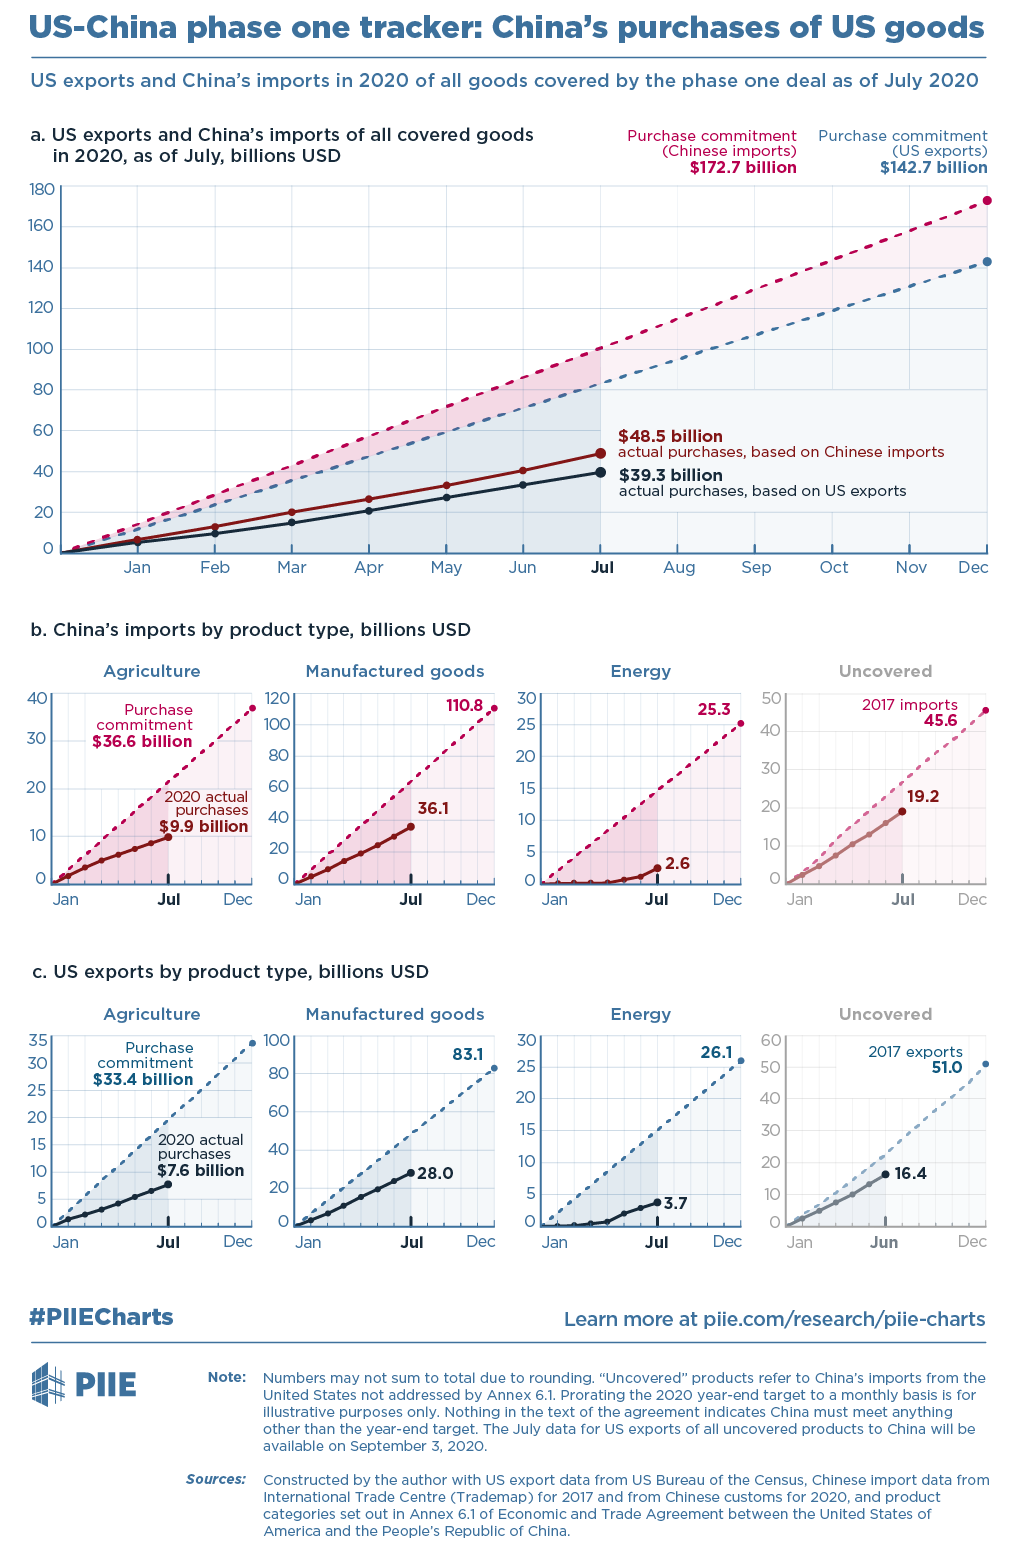
China trade deal progressing slowly
Read more: China trade deal progressing slowlyWe now have trade numbers for July 2020, and the U.S. trade deal with China is not meeting expectations.
-
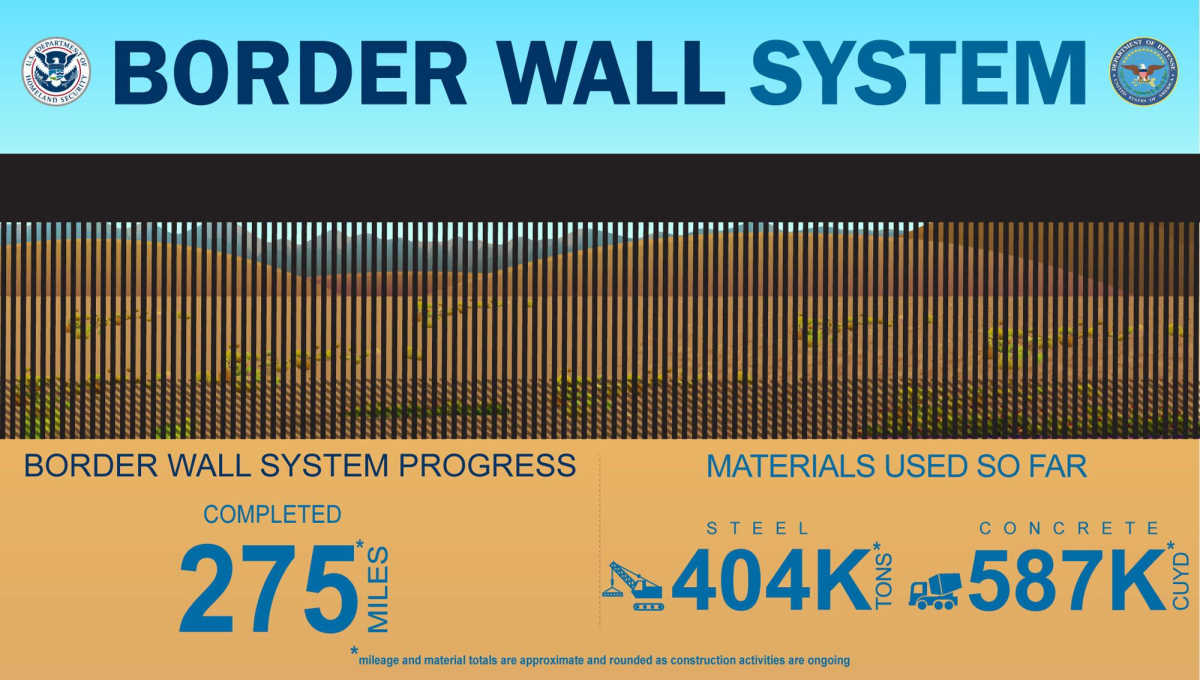
Border wall procedures criticized
Read more: Border wall procedures criticizedA government watchdog says the procedures for acquiring the southern border wall are inadequate, and the ability to maintain complete operational control is diminished.
-
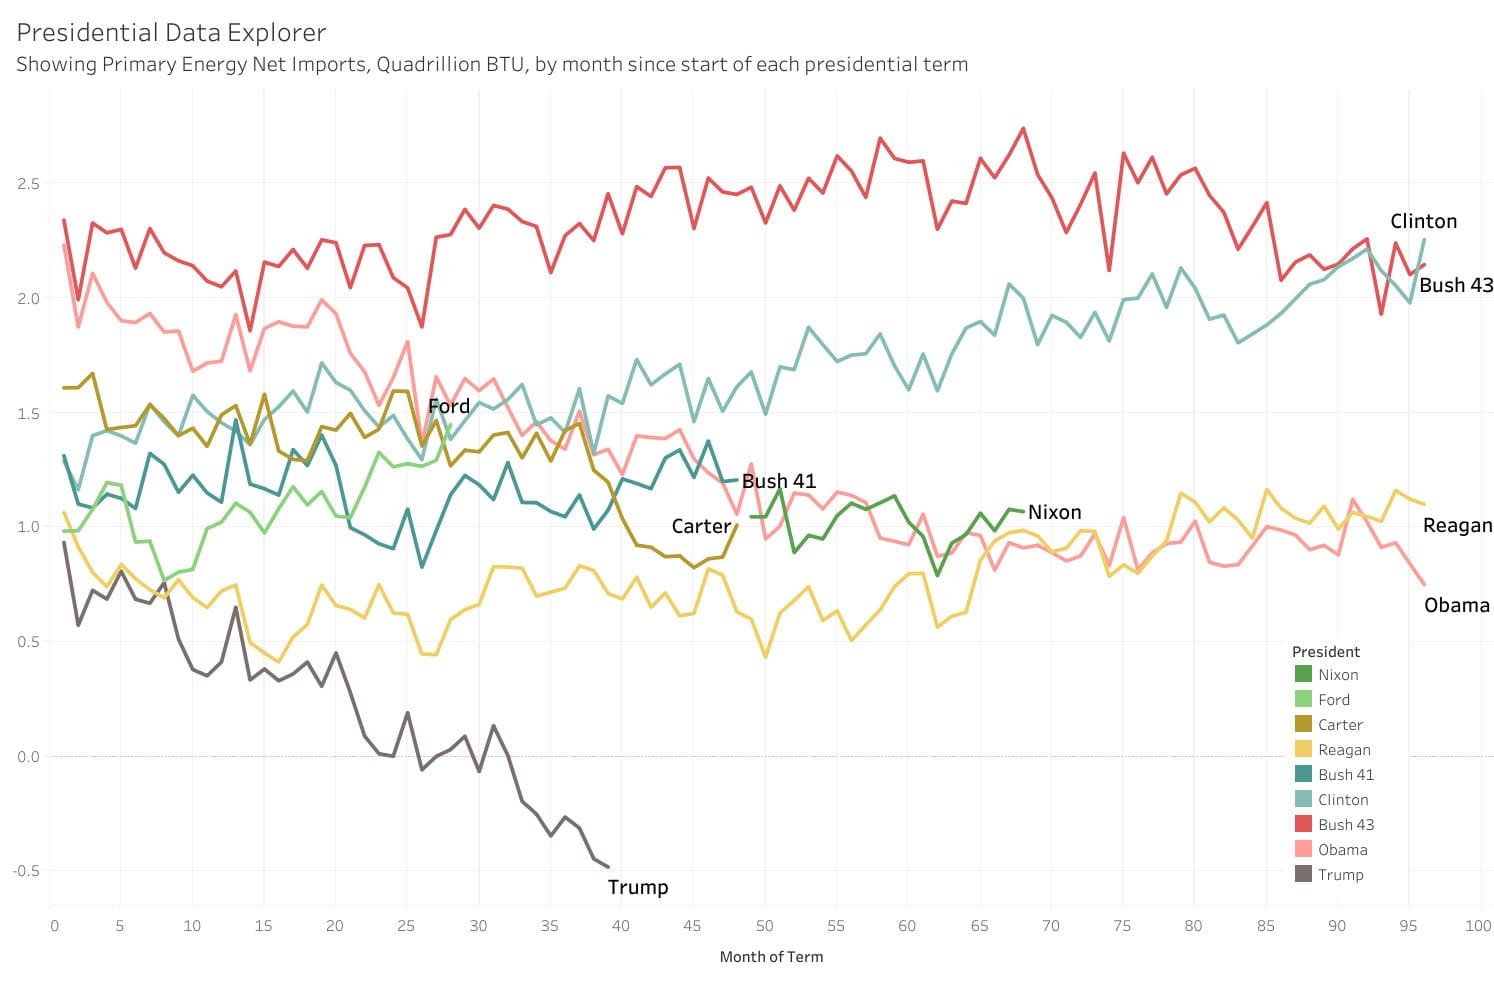
Added to presidential data explorer: Primary Energy Net Imports
Read more: Added to presidential data explorer: Primary Energy Net ImportsExplore the economic record of presidents through the lens of energy independence.
-

Economic development incentive to be canceled
Read more: Economic development incentive to be canceledThe City of Wichita will consider canceling an economic development incentive for a firm that no longer meets policy requirements.
-

Trump-supporting QAnon seen as public security threat
Read more: Trump-supporting QAnon seen as public security threatQAnon, a conspiracy theory group mentioned favorably by President Donald J. Trump and embraced by other Republican leaders, represents a public security threat, according to the Combating Terrorism Center at West Point.
-

Newsletter for August 23, 2020
Read more: Newsletter for August 23, 2020Here is your fresh edition of the newsletter from Voice For Liberty. This edition is dated August 23, 2020.
-
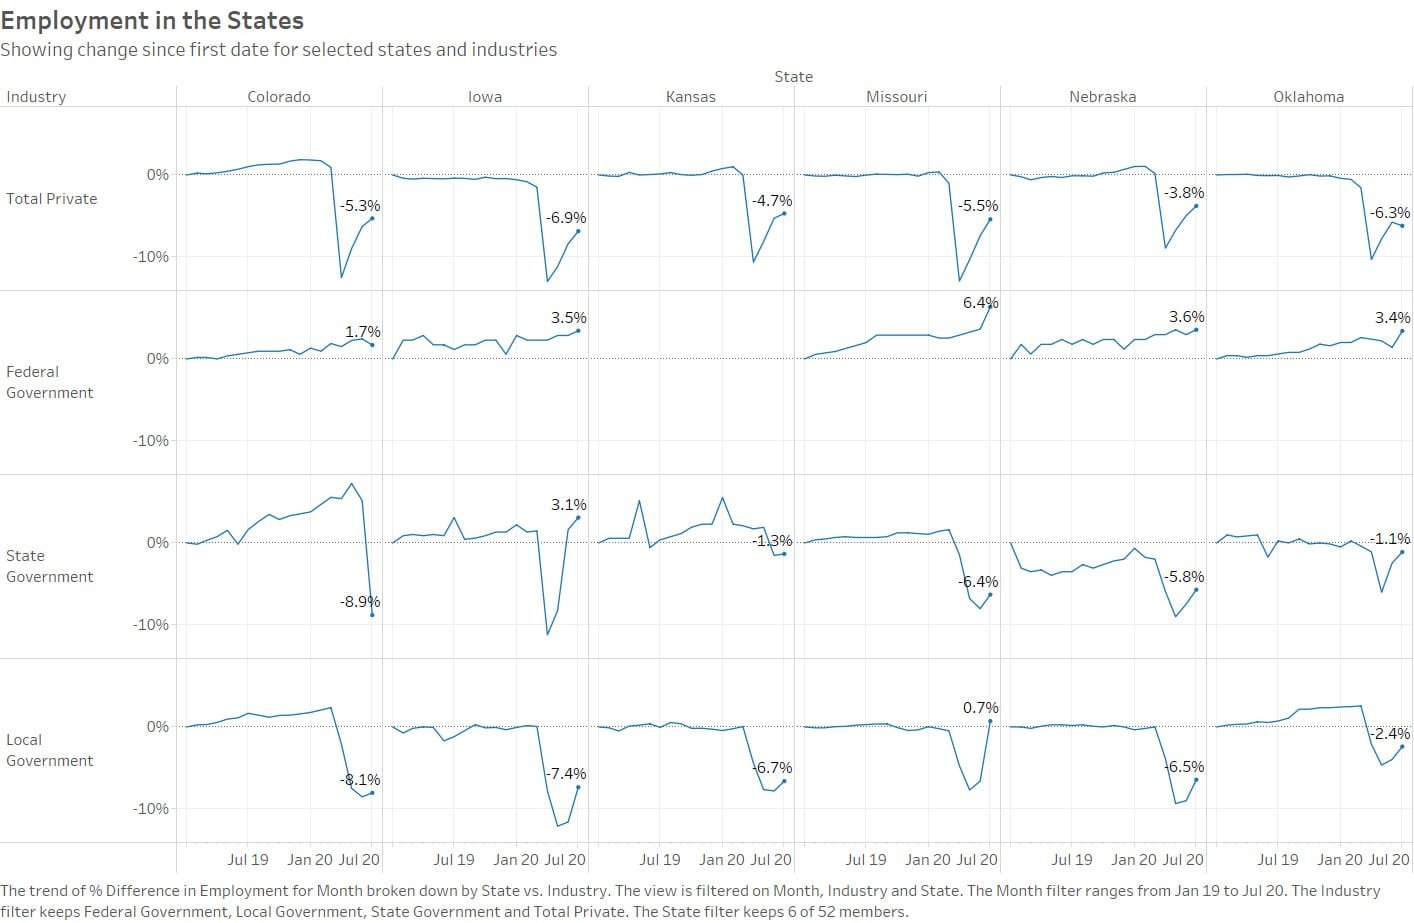
Updated: Effects of pandemic on employment in states
Read more: Updated: Effects of pandemic on employment in statesThe effects of the response to the pandemic vary widely among the states, but federal government employment has been little affected.
-
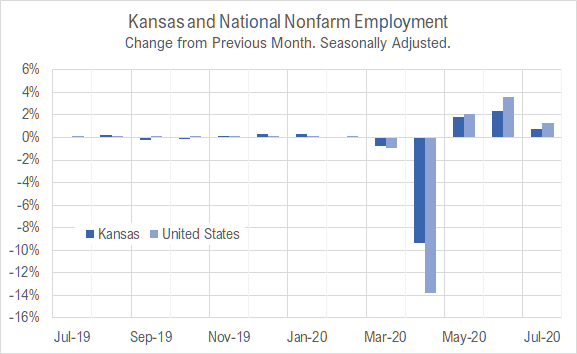
Kansas jobs, July 2020
Read more: Kansas jobs, July 2020The employment situation in Kansas continued to improve in July 2020 as the response to the pandemic continued to affect the economy.
-
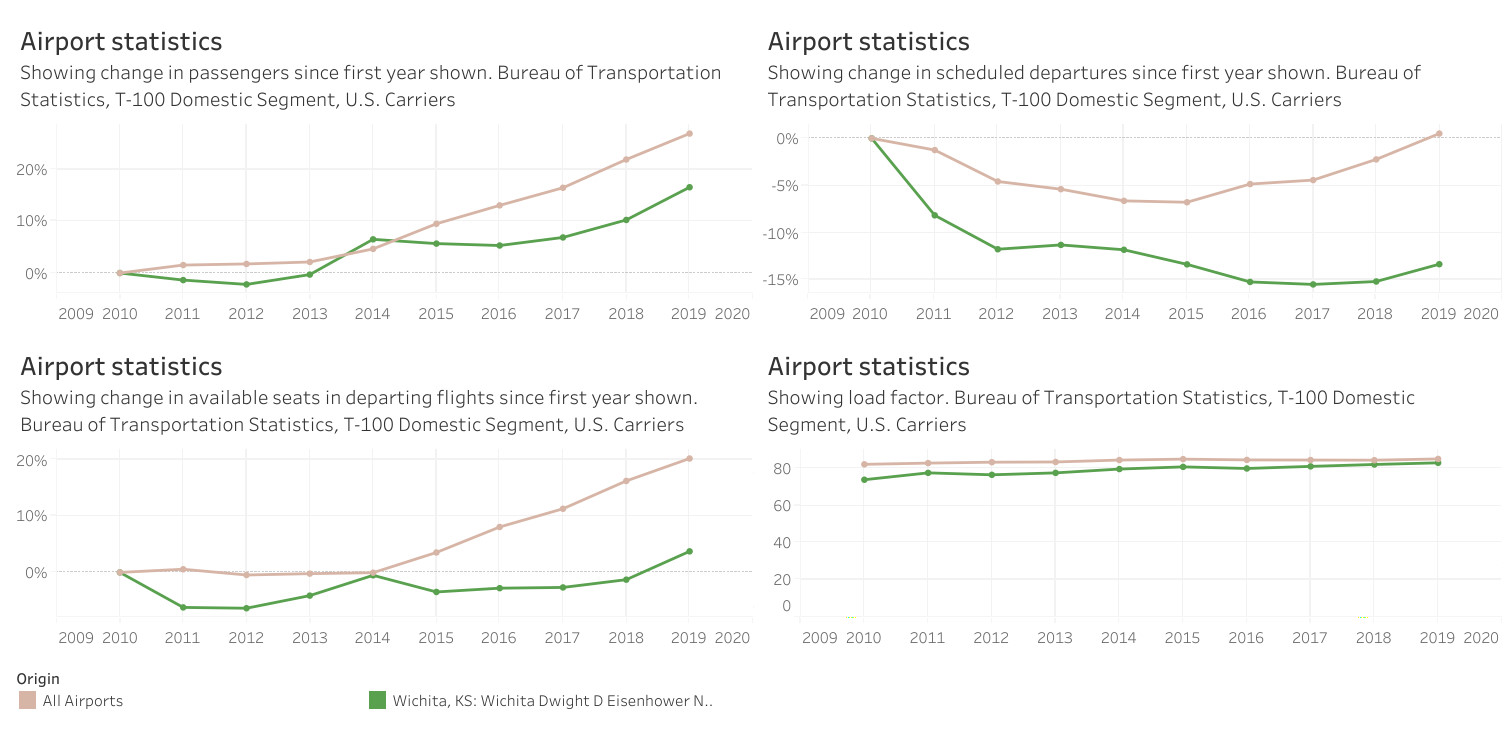
Airport traffic statistics, 2019
Read more: Airport traffic statistics, 2019Airport traffic data presented in an interactive visualization, updated through 2019.