In Rich States, Poor States, Kansas continues with middle-of-the-pack performance, and fell sharply in the forward-looking forecast.
In the 2016 edition of Rich States, Poor States, Utah continues its streak at the top of Economic Outlook Ranking, meaning that the state is poised for growth and prosperity. Kansas continues with middle-of-the-pack performance rankings, and fell sharply in the forward-looking forecast.
Rich States, Poor States is produced by American Legislative Exchange Council. The authors are economist Dr. Arthur B. Laffer, Stephen Moore, who is Distinguished Visiting Fellow, Project for Economic Growth at The Heritage Foundation, and Jonathan Williams, who is vice president for the Center for State Fiscal Reform at ALEC.
Rich States, Poor States computes two measures for each state. The first is the Economic Performance Ranking, described as “a backward-looking measure based on a state’s performance on three important variables: State Gross Domestic Product, Absolute Domestic Migration, and Non-Farm Payroll Employment — all of which are highly influenced by state policy.” The process looks at the past ten years.
Looking forward, there is the Economic Outlook Ranking, “a forecast based on a state’s current standing in 15 state policy variables. Each of these factors is influenced directly by state lawmakers through the legislative process. Generally speaking, states that spend less — especially on income transfer programs, and states that tax less — particularly on productive activities such as working or investing — experience higher growth rates than states that tax and spend more.”
For economic performance, Kansas is twenty-seventh. That’s up from twenty-eighth last year.
In this year’s compilation for economic outlook, Kansas ranks twenty-seventh, down from eighteenth last year and fifteenth the year before. In 2008, the first year for this measure, Kansas was twenty-ninth.
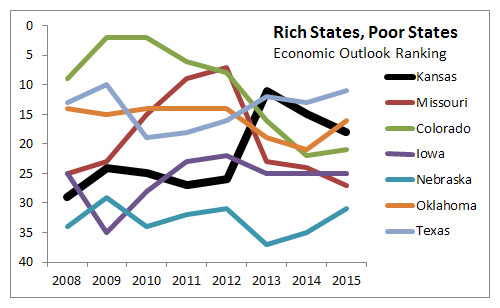
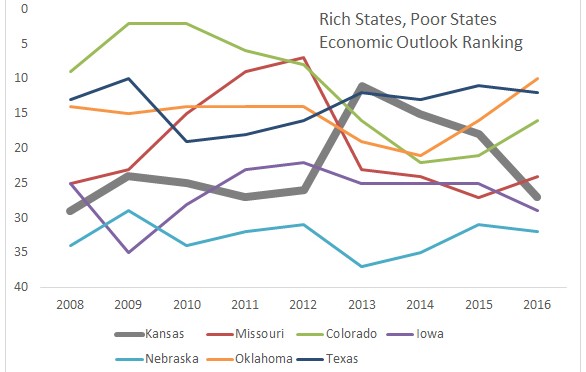
Kansas compared to other states

Why Kansas fell
 Kansas fell in the Economic Outlook Ranking from 2013 to 2016. To investigate why, I gathered data for Kansas from 2008 to 2016. The nearby table shows the results for 2016 and the rank among the states, with the trend since 2008 shown. A rank of one is the best ranking, so for the trend lines, an upward slope means a decline in ranking, meaning the state is performing worse.
There are several areas that may account for the difference.
The most notable change is in the measure “Recently Legislated Tax Changes (per $1,000 of personal income)” Kansas fell four positions in rank. By this measure, Kansas added $2.67 in taxes per $1,000 of personal income, which ranked forty-seventh among the states. This is a large change in a negative direction, as Kansas had ranked seventh the year before.
In “Property Tax Burden (per $1,000 of personal income)” Kansas improved one position in the rankings, despite the tax burden rising.
In “Sales Tax Burden (per $1,000 of personal income)” Kansas fell one spot in rank. The burden is calculated proportional to personal income. The sales tax burden, as measured this way, fell slightly in Kansas, but the ranking fell in comparison to other states. (Although the Kansas sales tax rate rose in 2015, this report uses data from 2013, which is the most recent data available from the U.S. Census Bureau. It’s likely that the 2015 sales tax hike will increase this burden, but whether the ranking changes depends on actions in other states.)
Kansas improved six rank positions for “Debt Service as a Share of Tax Revenue.”
Kansas remains one of the states with the most public employees, with 672 full-time equivalent employees per 10,000 population. This ranks forty-eighth among the states.
Kansas has no tax and spending limits, which is a disadvantage compared to other states. These limitations could be in the form of an expenditure limit, laws requiring voter approval of tax increases, or supermajority requirements in the legislature to pass tax increases.
How valuable is the ranking?

There is a distinctly positive relationship between the Rich States, Poor States’ economic outlook rankings and current and subsequent state economic health.
The formal correlation is not perfect (i.e., it is not equal to 100 percent) because there are other factors that affect a state’s economic prospects. All economists would concede this obvious point. However, the ALEC-Laffer rankings alone have a 25 to 40 percent correlation with state performance rankings. This is a very high percentage for a single variable considering the multiplicity of idiosyncratic factors that affect growth in each state — resource endowments, access to transportation, ports and other marketplaces, etc.