Tag: Economic development
-
In Wichita, we don’t know who we’re dealing with
Wichita takes a big risk entering in a public-private partnership without knowing its partners.
-
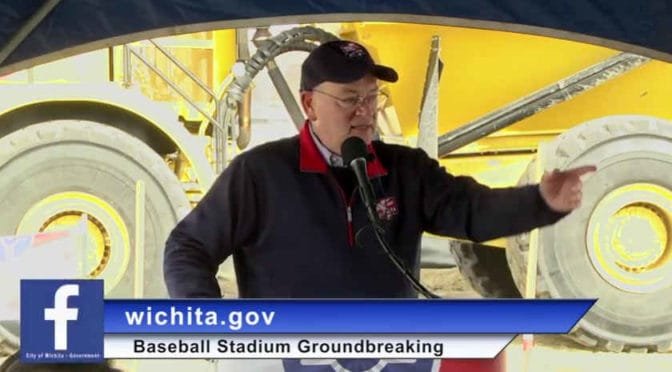
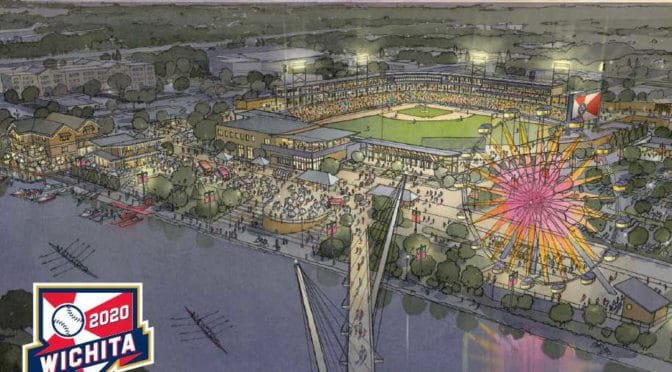
Wichita considers a new stadium
The City of Wichita plans subsidized development of a sports facility as an economic driver. Originally published in July 2017.
-
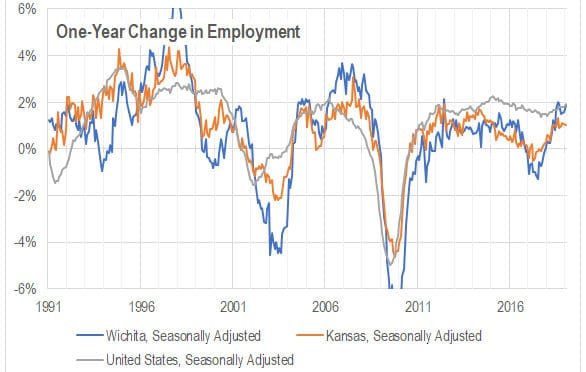
Wichita and national jobs
Growth of employment in Wichita compared to the nation.
-
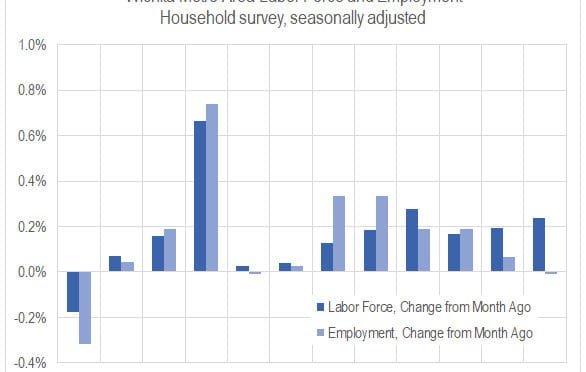
Wichita jobs and employment, January 2019
For the Wichita metropolitan area in January 2019, jobs are up, the labor force is up, and the unemployment rate is unchanged when compared to the same month one year ago. Seasonal data shows a slowdown in the rate of job growth and a rising unemployment rate.
-

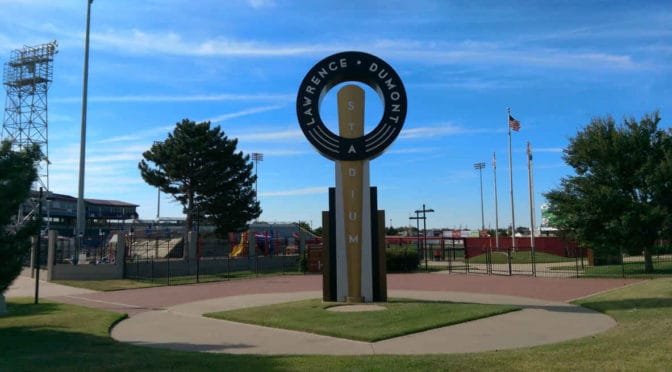
Wichita city protections for ballpark land development
The City of Wichita says it has safeguards built in to the proposed baseball park land development deal.
-
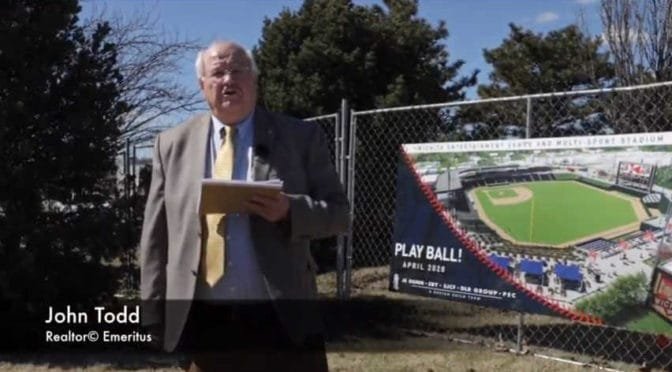
Wichita ballpark land deal: John Todd
John Todd tells us why the city is not acting in the best interest of citizens regarding the land development deal near the new Wichita ballpark.
-
Wichita vets its baseball partner(s)
The City of Wichita tells us it has thoroughly vetted the majority owner of the new Wichita baseball team.
-
Wichita baseball team travel agreement not known
Part of the agreement with the new Wichita baseball team is, apparently, unknown.
-
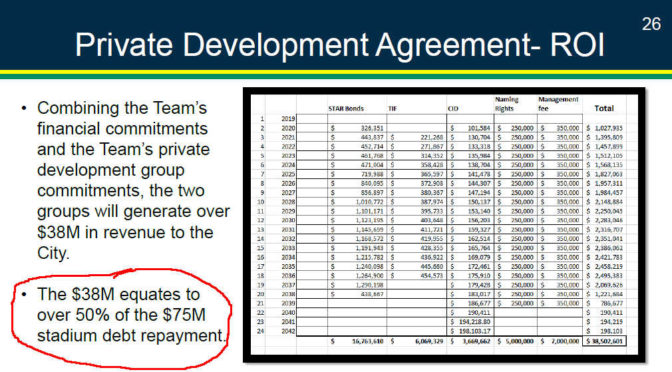
Did Wichita forget the interest?
In a presentation, Wichita economic development officials ignore the cost of borrowing money.
-

In Wichita, respecting the people’s right to know
The City of Wichita says it values open and transparent government. But the city’s record in providing information and records to citizens is poor, and there hasn’t been much improvement.
-
Wichita ballpark STAR bonds, 2018 issue
A bond disclosure document anticipated a development agreement for land surrounding the new Wichita ballpark.
-
Update: Wichita city sales tax not passed
There was no successful Wichita city sales tax election. City documents were mistaken, which raises more issues.