Tag: Economic development
-

In Wichita, no tenant poaching, unless waived
The city of Wichita has included anti-poaching clauses in development agreements to protect non-subsidized landlords, but the agreements are without teeth.
-

Slow down on Wichita ballpark land deal
A surprise deal that has been withheld from citizens will be considered by the Wichita City Council this week.
-
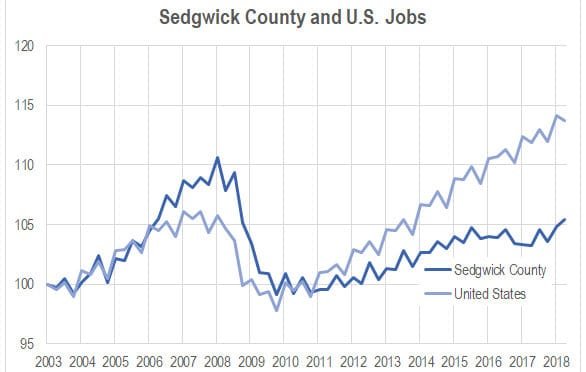
Sedgwick County job growth exceeds national rate
In the third quarter of 2018, Sedgwick County quarterly job growth exceeded the national rate for the first time in nearly ten years.
-

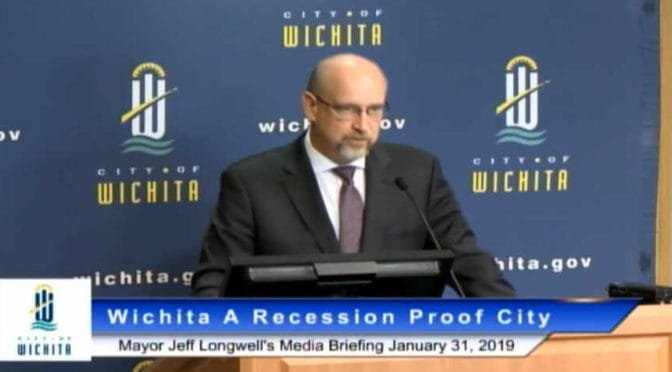
Is the Wichita mayor satisfied with this?
A gloomy jobs forecast is greeted with apparent approval by Wichita Mayor Jeff Longwell.
-
Wichita mayor promotes inaccurate picture of local economy
Wichita city leaders will latch onto any good news, no matter from how flimsy the source. But they ignore the news they don’t like, even though it may come from the U.S. Census Bureau, U.S. Bureau of Labor Statistics, or U.S. Bureau of Economic Analysis.
-
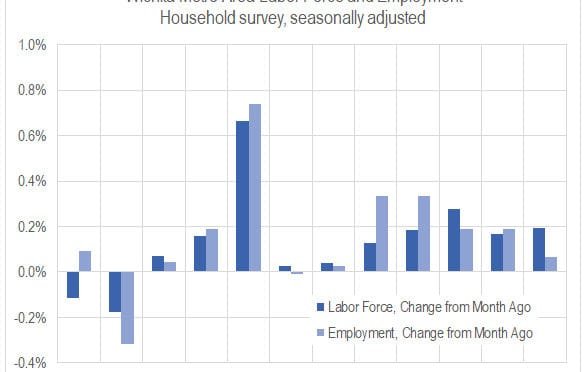
Wichita jobs and employment, December 2018
For the Wichita metropolitan area in December 2018, jobs are up, the labor force is up, and the unemployment rate is down when compared to the same month one year ago. Seasonal data shows a slowdown in the rate of job growth and a rising unemployment rate.
-
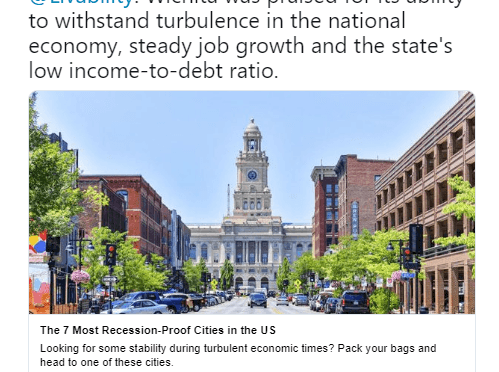
Wichita, a recession-proof city
Wichita city officials promote an article that presents an unrealistic portrayal of the local economy.
-
Job growth in Wichita: Great news?
A tweet from a top Wichita city official promotes great news that really isn’t so great.
-

Retiring Sedgwick County Commissioner Dave Unruh praised
The praise for retired Sedgwick County Commissioner Dave Unruh can’t be based on our region’s accomplishments under his guidance. That is, if people are informed and truthful.
-

In Wichita, a gentle clawback
Despite the mayor’s bluster, Wichita mostly lets a company off the hook.
-

Wichita migration not improving
Data from the United States Census Bureau shows that the Wichita metropolitan area has lost many people to domestic migration, and the situation is not improving.
-
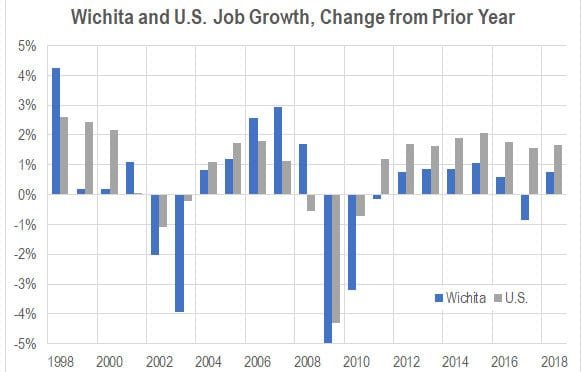
Wichita employment to grow in 2019
Jobs are forecasted to grow in Wichita in 2019, but the forecasted rate is low.