Tag: Economics
-
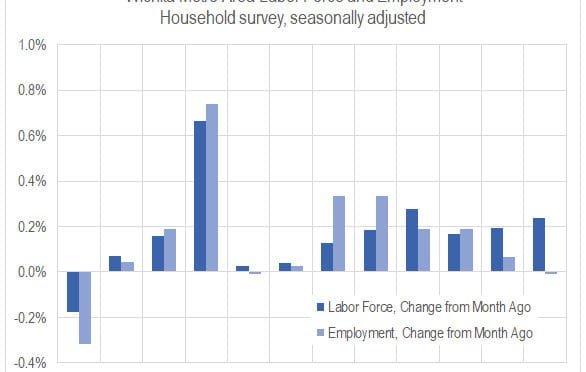
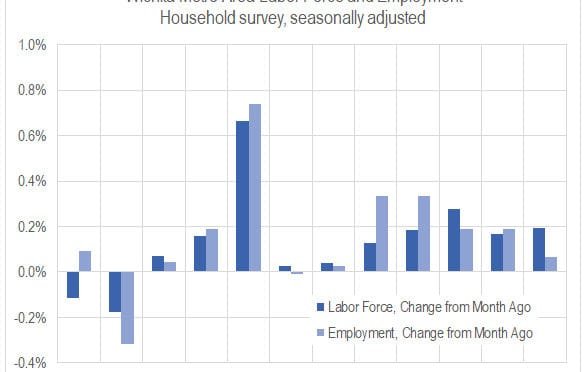
Wichita jobs and employment, January 2019
For the Wichita metropolitan area in January 2019, jobs are up, the labor force is up, and the unemployment rate is unchanged when compared to the same month one year ago. Seasonal data shows a slowdown in the rate of job growth and a rising unemployment rate.
-
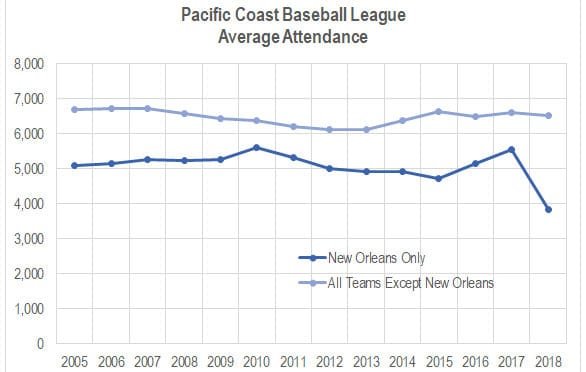
Pacific Coast League attendance
Average game attendance for the Pacific Coast minor league baseball league.
-

Kansas jobs, January 2019
Employment in Kansas continues to grow, but slower than the nation.
-
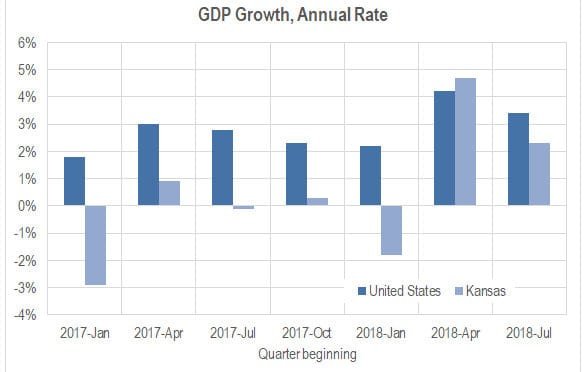
Kansas GDP
In the third quarter of 2018, the Kansas economy grew at the annual rate of 2.3 percent, down from 4.7 percent the previous quarter.
-
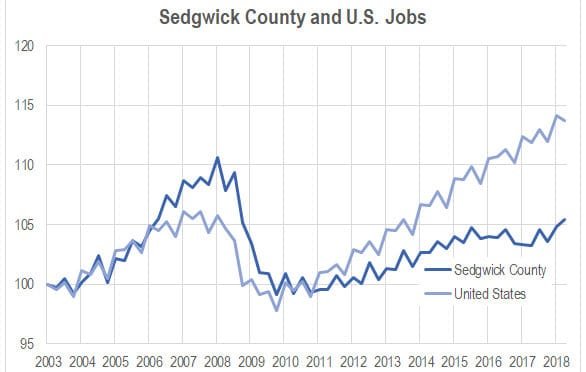
Sedgwick County job growth exceeds national rate
In the third quarter of 2018, Sedgwick County quarterly job growth exceeded the national rate for the first time in nearly ten years.
-
Wichita mayor promotes inaccurate picture of local economy
Wichita city leaders will latch onto any good news, no matter from how flimsy the source. But they ignore the news they don’t like, even though it may come from the U.S. Census Bureau, U.S. Bureau of Labor Statistics, or U.S. Bureau of Economic Analysis.
-
Wichita jobs and employment, December 2018
For the Wichita metropolitan area in December 2018, jobs are up, the labor force is up, and the unemployment rate is down when compared to the same month one year ago. Seasonal data shows a slowdown in the rate of job growth and a rising unemployment rate.
-
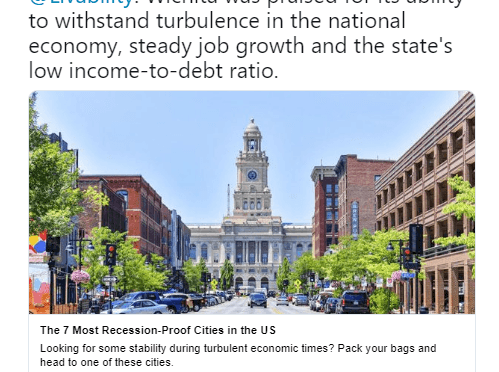
Wichita, a recession-proof city
Wichita city officials promote an article that presents an unrealistic portrayal of the local economy.
-
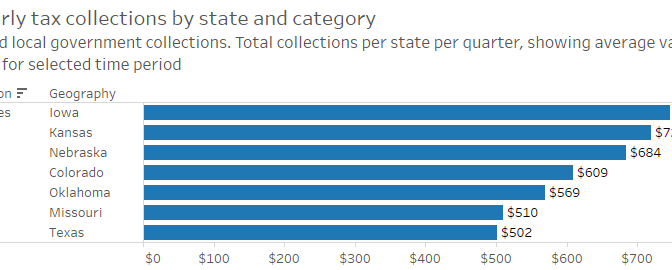
State tax collections updated
Now updated with data through the third quarter of 2018, quarterly state and local government tax collections.
-

Retiring Sedgwick County Commissioner Dave Unruh praised
The praise for retired Sedgwick County Commissioner Dave Unruh can’t be based on our region’s accomplishments under his guidance. That is, if people are informed and truthful.
-

Kansas jobs, December 2018
For Kansas in December 2018, a growing labor force and more jobs, but a slightly rising unemployment rate.
-

Wichita migration not improving
Data from the United States Census Bureau shows that the Wichita metropolitan area has lost many people to domestic migration, and the situation is not improving.