Tag: Featured

  • Kansas schools and other states

    Kansas schools and other states

    A joint statement released by Kansas Association of School Boards, United School Administrators of Kansas, Kansas School Superintendents’ Association, and Kansas National Education Association makes claims about Kansas public schools that aren’t factual.

    The Kansas public school establishment is proud of Kansas schools. In a joint statement released at the start of this year’s legislative session, satisfaction with schools is evident: “Our Kansas public schools are great. … The results are there. Working with parents and communities, Kansas schools rank in the top ten nationally on every measure on reading and math tests, high school completion and college preparation.”

    According to National Center for Education Statistics, Kansas does have a high percentage of students that graduate from high school. But this is the only bright spot for Kansas students. In many other measures Kansas is near the middle of the states, and in some cases much below the middle.

    In the recent report Quality Counts by Education Week, Kansas ranked twentieth overall among the states.

    For last year’s ACT scores, Kansas ranked twenty-first in composite score. Kansas ranked twentieth in readiness for college in English, and twentieth also for math readiness.

    In U.S. News and World Report’s How States Compare in the 2015 Best High Schools Rankings, we find Kansas ranked forty-fifth among the states, with 1.3 percent of its high schools earning a gold or silver medal. There were no gold medals; only silver.

    The National Assessment of Educational Progress (NAEP), known as “The Nation’s Report Card,” reveals the unfortunate weakness in Kansas schools. NAEP is a test that is the same in all jurisdictions. Consider fourth grade math, looking at the percent of students who score “proficient” or better. For all students, Kansas ranks twenty-second, a little above the middle. But when we look at subgroups, something else appears. For black students Kansas ranks thirty-eighth, for Hispanic students the rank is thirty-fourth, and for white students the rank is twenty-ninth. Similar patterns exist for math and reading in grades four and eight. The highest Kansas ranks in any subgroup is fifteenth for grade eight math for Hispanic students. (Click here for a pdf version of these rankings. An interactive visualization of these scores is here.)

    NAEP Scores, Kansas and National. Click for larger version.
    NAEP Scores, Kansas and National. Click for larger version.
    When comparing Kansas NAEP scores to the national average, using appropriate subgroups, we find that often Kansas underperforms the national average. The reason for this anomaly is Simpson’s Paradox, in which aggregated data hides differences between subgroups. Given that white students across the nation score higher than black or Hispanic students, and that Kansas has a high proportion of white students compared to the nation and many states, Simpson’s Paradox makes Kansas NAEP scores — only when considering all students — appear high. But if you are a parent with young black children learning to read, would you rather be in Kansas (thirty-seventh in reading for black students, grade four), Louisiana (twenty-fifth), or Colorado (third)?

    It’s unfortunate that Kansas does not rank better in all these measures. What’s worse is the insistence that Kansas schoolchildren are doing well. Notwithstanding this evidence, after listing all the ways Kansas schools and teachers work to make school great, the joint statement says “This is how the Kansas school system operates. We are good at.”

    But it isn’t good for Kansas schoolchildren to be in a system that does not recognize the truth.
  • Must it be public schools?

    Must it be public schools?

    A joint statement released by Kansas Association of School Boards, United School Administrators of Kansas, Kansas School Superintendents’ Association, and Kansas National Education Association exposes the attitudes of the Kansas public school establishment.

    In a joint statement by the leaders of the Kansas public school establishment the clear theme is that education must be provided by public schools. Not schools in general, but public schools.

    There’s no reason that education must be provided by government, and many reasons to keep government out of education. Across the spectrum of human activity, government provides services at high cost, with low levels of diversity and innovation, and with low accountability. School choice programs allow parents and children to find alternative non-governmental sources of education (although charter schools are public schools).

    Defenders of public schools over school choice programs note that parents do have choice. Parents can, they say, enroll their children in private schools. But these parents still must pay for the public schools, which severely reduces their ability to pay private school tuition. That isn’t much choice. And for parents in poor neighborhoods, such as Wichita’s zip code 67214 where the median family income is $29,637, there isn’t much money available for private school tuition, or to move their households to suburban school districts. The latter is a form of school choice available to middle-class and wealthy parents that isn’t available to low-income families.

    Across the country 393,467 students participate in school choice programs, in this case defined as vouchers, tax credit scholarships, or education savings accounts. 1 There are around 49 million students in public schools. So for every one student in these school choice programs, 125 students remain in public schools.

    Despite the small number of students enrolled in school choice programs, the anti-choice establishment vigorously fights against any school choice program, even the small Kansas tax credit scholarship program. Kansas State Department of Education reports that since the beginning of the scholarship program, there have been 73 students awarded scholarships which totaled $108,384. 2

    Seventy-three students. $108,384. The public school establishment describes this as a grave threat, something that drains public schools of funds. For a bit of context, there are executives of Kansas Association of School Boards and Kansas National Education Association that earn more than $108,384 per year. These executives earn these salaries, in part, by blocking the type of school choice programs that benefit children living in Wichita’s zip code 67214 with its median family income of $29,637.

    Why is the public school establishment so firmly against school choice? Private schools don’t pay dues to the Kansas Association of School Boards. Teachers not in traditional public schools are not members of Kansas National Education Association, the teachers union. Without this revenue, it might be difficult to pay the high salaries of KASB and KNEA executives and staff.

    But there’s more. The ideological bent of these groups is for more government, more taxes, more government spending, and more governmental control over the people of Kansas. Consider this sentence from the joint statement: “Now, we turn our attention this week to the Statehouse in Topeka where the Legislature is gathering to consider how to provide for the people of Kansas.” (emphasis added)

    In a nutshell, there is the paternalistic governing philosophy of our state’s public school establishment: Government provides for us.

  • Wichita water statistics update

    Wichita water statistics update

    The Wichita ASR water project produced little water in December. There were 31 days when river flow was adequate.

    An important part of Wichita’s water supply infrastructure is the Aquifer Storage and Recovery program, or ASR. This is a program whereby water is taken from the Little Arkansas River, treated, and injected in the Equus Beds aquifer. That water is then available in the future as is other Equus Beds water.

    With a cost so far of $247 million, the city believes that ASR is a proven technology that will provide water and drought protection for many years. In 2014 the city recommended that voters approve $250 million for its expansion, to be paid for by a sales tax. Voters rejected the tax in the November 2014 election.

    December 2015 production

    Flow of the Little Arkansas River at Valley Center. The ASR project is able to draw from the river when the flow is above 30 cfs at this measurement station.
    Flow of the Little Arkansas River at Valley Center. The ASR project is able to draw from the river when the flow is above 30 cfs at this measurement station.
    In December 2015, the ASR project recharged 19,138,651 gallons of water. The design capacity for ASR is 30,000,000 gallons per day, so production for the entire month of December is less than one day’s design capacity.

    The ASR project is able to draw from the Little Arkansas River when the flow is above 30 cfs. As can be seen in the chart of the flow of the river, the flow was above this level every day. There were 31 days in December when there was adequate river flow for ASR to operate, counting only those days when the flow was above 30 cfs for the entire day.

    ASR project background and production

    According to city documents, the original capacity of the ASR phase II project to process water and pump it into the ground (the “recharge” process) was given as “Expected volume: 30 MGD for 120 days.” That translates to 3,600,000,000 (3.6 billion or 3,600 million) gallons per year. ASR phase II was completed in 2011.

    Gallons of Water Recharged Through Recharge Basins and Wells during Wichita ASR Phase II, cumulative since July 2013.
    Gallons of Water Recharged Through Recharge Basins and Wells during Wichita ASR Phase II, cumulative since July 2013.
    At a city council workshop in April 2014, Director of Public Works and Utilities Alan King briefed the council on the history of ASR, mentioning the original belief that ASR would recharge 11,000 acre feet of water per year. But he gave a new estimate for production, telling the council that “What we’re finding is, we’re thinking we’re going to actually get 5,800 acre feet. Somewhere close to half of the original estimates.” The new estimate translates to 1,889,935,800 (1.9 billion) gallons per year.

    Based on experience, the city has produced a revised estimate of ASR production capability. What has been the actual experience of ASR? The U.S. Geological Survey has ASR figures available here. I’ve gathered the data and performed an analysis. (Click charts for larger versions.)

    Gallons of Water Recharged Through Recharge Basins and Wells during Wichita ASR phase II, monthly
    Gallons of Water Recharged Through Recharge Basins and Wells during Wichita ASR phase II, monthly
    I’ve produced a chart of the cumulative production of the Wichita ASR project compared with the original projections and the lower revised projections. The lines for projections rise smoothly, although it is expected that actual production is not smooth. The second phase of ASR was completed sometime in 2011, but no water was produced and recharged that year. Further, 2013 was a drought year, so to present ASR in the best possible light, I’ve prepared a chart starting in July 2013. That was when it started raining heavily, and data from USGS shows that the flow in the Little Arkansas River was much greater. Still, the ASR project is not keeping up with projections, even after goals were lowered.

    On the chart of monthly production, the horizontal line represents the revised annual production projection expressed as a constant amount each month. This even rate of production is not likely, as river flow varies. In the three years that ASR phase II has been in production, that monthly target been exceeded in three months.

    ASR days of flow and work through 2015-12
    ASR operating efficiency through 2015-12Two nearby charts give an idea of the efficiency of operation of the ASR project. (Click charts for larger versions.) For each month, I counted how many days had a river flow above 30 cfs at every measurement for the day. (The flow is measured several dozen times a day.) If a day had all measurements above 30 cfs, I counted that as a day of adequate river flow. I then calculated the number of days of work actually accomplished using the water produced each month, the number of days of adequate river flow for the month, and the ASR design capacity.

    As can be seen in the charts, the ASR project is operating far below its design goal. So far the city has not been able to provide an explanation as to why this project is not meeting its goals.

    At one time the city was proud enough of the ASR project that it maintained an informative website at wichitawaterproject.org. That site no longer exists.
    At one time the city was proud enough of the ASR project that it maintained an informative website at wichitawaterproject.org. That site no longer exists.
  • Kansas Attorney General Derek Schmidt

    Kansas Attorney General Derek Schmidt

    Kansas Attorney General Derek Schmidt
    Kansas Attorney General Derek Schmidt
    Kansas Attorney General Derek Schmidt spoke to members and guests of the Wichita Pachyderm Club on January 22, 2106. He addressed cases before the Kansas and United States Supreme Courts, including the Wichita marijuana case and the Carr Brothers appeal. This is an audio presentation.

  • Kansas highway conditions

    Kansas highway conditions

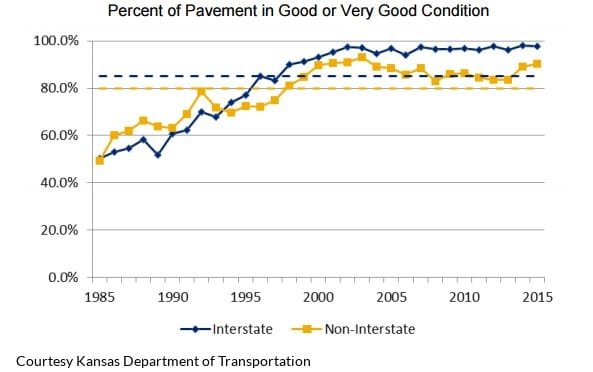
    Has continually “robbing the bank of KDOT” harmed Kansas highways?

    The long-time practice of transferring money from the state’s highway fund to the general fund — known as “robbing the bank of KDOT” — is criticized as being harmful to the condition of the state’s highways.

    Data from Kansas Department of Transportation shows that the condition of Kansas highways improved during the 1980s and 1990s. The highways have remained in a high level of condition since then.

    This is not to argue in favor of transferring highway funds, but to show that Kansas highways are not deteriorating as some alledge.

    Kansas percentage of pavement in good or very good condition 2015

  • Pupil-teacher ratios in the states

    Pupil-teacher ratios in the states

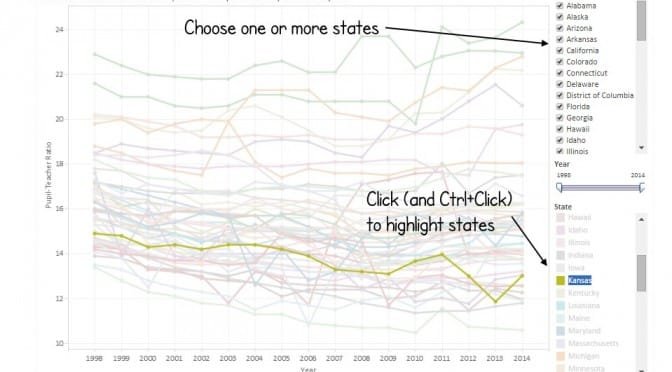
    Kansas ranks near the top of the states in having a low pupil-teacher ratio.

    Pupil-Teacher Ratios in the States. Click for larger version.
    Pupil-Teacher Ratios in the States. Click for larger version.
    Data from National Center for Education Statistics, ELSI Elementary and Secondary Information System, shows that Kansas is near the top of the states in pupil-teacher ratio, meaning that Kansas has many teachers compared to the number of students.

    A common complaint in Kansas is that class sizes have been rising. While pupil-teacher ratio is not the same measure as class size, the question is this: If Kansas has a low pupil-teacher ratio, but class sizes are large and rising, what are these teachers doing?

    In the chart of pupil-teacher ratios over time, we see that while the ratio in Kansas rose during the 2014 school year, the trend over time is down, meaning that the number of teachers has increased faster than enrollment. Also, note the position of Kansas compared to other states. The pupil-teacher ratio in Kansas is lower than in most states.

    Click here to access the visualization.

    Pupil-teacher Ratios in the States, Kansas highlighted.
    Pupil-teacher Ratios in the States, Kansas highlighted.
  • Kansas efficiency study released

    Kansas efficiency study released

    An interim version of a report presents possibilities of saving the state $2 billion over five years.

    This week the Kansas Legislature received an interim version of the efficiency report it commissioned last year. Said by its creators to involve a team of more than 40 professionals who devoted over 6,000 hours, it is described as an “in-depth analysis of the operations of [participating state] agencies.”

    The bottom line is this: “This report includes 105 recommendations which cumulatively would provide $2.04 billion in benefits to the State over the next five years.”

    Undoubtedly this report will be the subject of discussion and debate over the next few years. It is through that process we will discover which recommendations are feasible, and more importantly, which are within the realm of political possibilities.

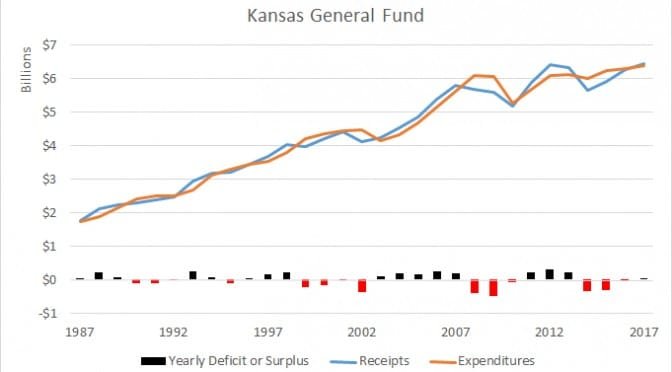
    It’s important to place this report in context. In 2012 the legislature reduced tax rates. While some, perhaps many, do not like the way the tax cuts were distributed, a central fact remains: The cuts were designed to leave more money in the private sector. Therefore, state government needed to shrink in order to match the lower revenue. But that did not happen. The governor and legislature were unwilling to make meaningful spending cuts. Instead, the state used its positive bank balance to support increased spending, and then in 2015 raised taxes.

    The question is this: Why didn’t the legislature initiate this efficiency study in 2012? Why did it wait until 2015? The authors of the study claim there is much savings to be had, more than what was needed to reconcile spending with revenue the past few years. But the last three years are now lost to time. If it’s true that the efficiency study will yield real savings, then the governor and legislature were three years late starting the process. There is no excuse for that, and all parties deserve criticism. The savings could have been used to reduce the burden of the state’s high sales tax on groceries for low-income families. The savings could have been used to tackle the waiting lists for social services. But these opportunities have been squandered.

    More context is that Kansas liberals and moderates almost universally condemn the study and its $2.6 million price tag. But if the study produces real savings, they can be used to fund items like the two mentioned in the previous paragraph, or for other spending programs liberals and moderates want.

    Finding a copy of the report online is not straightforward. Click here to view.

  • Kansas state and local tax revenue

    Kansas state and local tax revenue

    Tax group definitions.
    Tax group definitions.
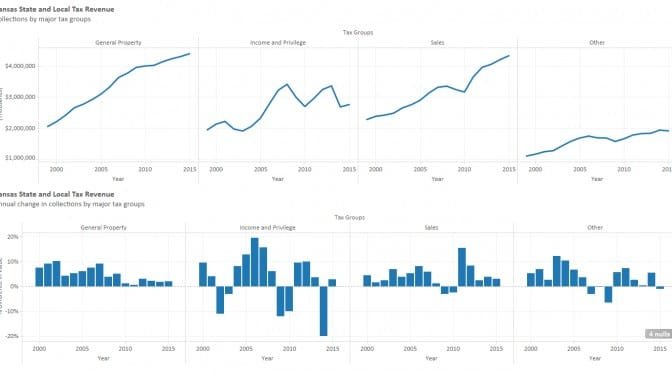
    In order to simplify this chart, I created four groups of taxes. As there are many taxes that are small in amount, I group them together as “Other.” For the group “Sales” I include the general sales and use tax, plus the cigarette and tobacco tax, plus liquor and beer tax, as these are of the same nature as the general sales tax.

    Note this is both taxes collected by the state, and also by local governments.

    Source of data is Kansas Tax Facts, various years. Values are nominal; not adjusted for inflation. To access the interactive visualization that is the basis of the example shown below, click here.

    Kansas State and Local Tax Revenue. Click for larger.
    Kansas State and Local Tax Revenue. Click for larger.