Tag: Featured
-

Wichita City Council to consider a clawback
The unrealized potential of an economic development incentive teaches lessons.
-

From Pachyderm: Martin Hawver
From the Wichita Pachyderm Club: Martin Hawver, dean of the Kansas Statehouse press corps. This was recorded January 4, 2019.
-
Wichita employment, November 2018
For the Wichita metropolitan area in November 2018, jobs are up, the labor force is up, and the unemployment rate is down, compared to the same month one year ago. Seasonal data shows a slowdown in the rate of job growth.
-

Sedgwick County tops $434K in extra personnel costs
Sedgwick County has spent $434,663 in costs relating to the separations of two members of top management.
-

Kansas agency expenditures
Data regarding State of Kansas agency spending presented in an interactive visualization.
-

Year in Review: 2018
Here are highlights from Voice for Liberty for 2018. Was it a good year for the principles of individual liberty, limited government, economic freedom, and free markets in Wichita and Kansas?
-

Merry Christmas!
Merry Christmas from my home to yours.
-

Kansas tax credit scholarship program
An op-ed in the Wichita Eagle regarding school choice prompts uninformed and misinformed comments.
-
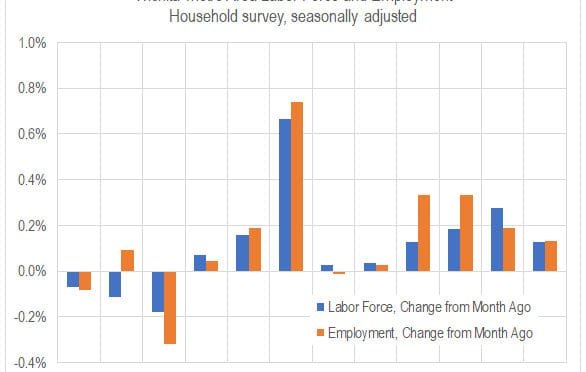
Kansas jobs, November 2018
For November 2018, a growing labor force and more employment, but growing more slowly from October.
-
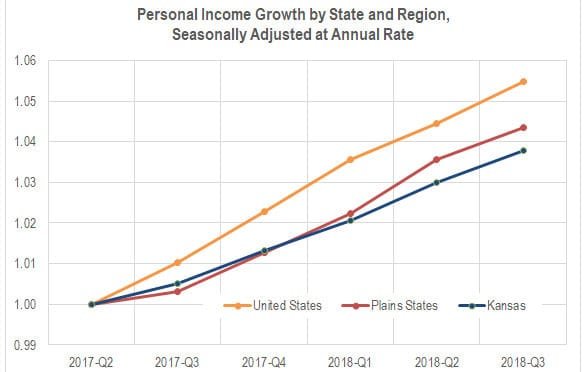
Kansas personal income rises
Kansas personal income grew in the third quarter of 2018, but slower than in most states.
-

Starlite loan isn’t needed
The Wichita City Council seems poised to enter an unnecessarily complicated transaction.
-

Sedgwick County tax exemptions
Unlike the City of Wichita, Sedgwick County has kept track of its tax exemptions.