Tag: Featured
-

From Pachyderm: Congressman Mike Pompeo
From the Wichita Pachyderm Club: Congressman Mike Pompeo delivered an update on the issues of the day and answered questions.
-

In Wichita, developer welfare under a cloud
A downtown Wichita project receives a small benefit from the city, with no mention of the really big money.
-

Kansas school fund balances
Kansas school fund balances rose significantly this year, in both absolute dollars and dollars per pupil.
-
WichitaLiberty.TV: Radio host Andy Hooser
Radio show host Andy Hooser visits the KGPT studios to talk about upcoming elections in Kansas and the presidential campaign.
-

Topeka Capital-Journal falls for a story
The editorial boards of two large Kansas newspapers have shown how little effort goes into forming the opinions they foist upon our state.
-
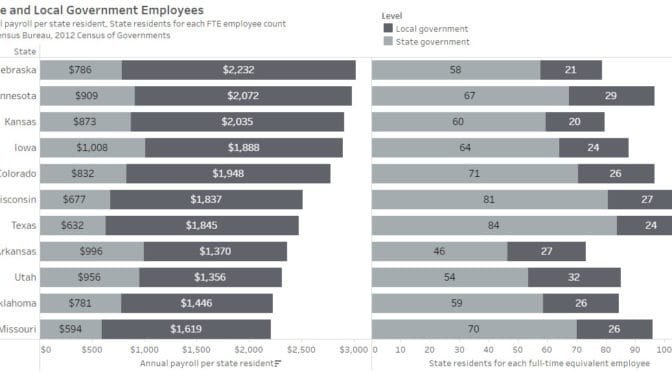
Kansas, a frugal state?
Is Kansas a frugal state, compared to others?
-
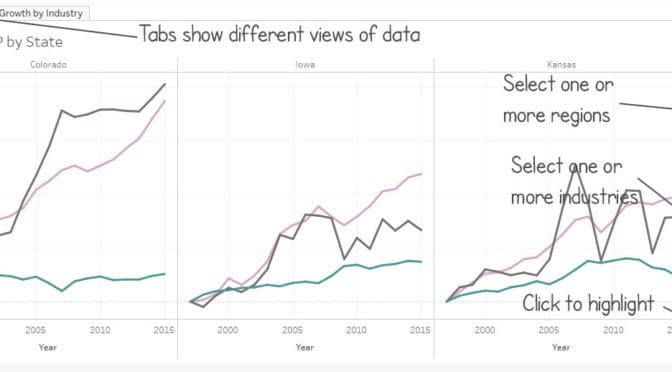
GDP by state and component
An interactive visualization of gross domestic product by state and industry.
-
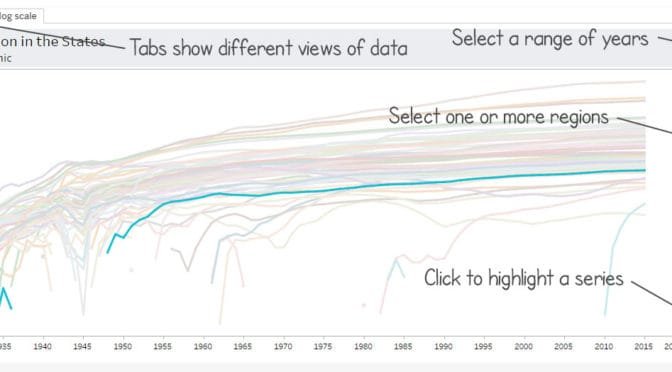
Populations of the states
An interactive table and charts of populations in the states and regions, starting in 1929.
-

Kansas government spending
Kansas government spending, starting in 1967. Total spending and per capita spending, adjusted for inflation. Also, spending as percent of Kansas GDP.
-

WichitaLiberty.TV: Lawrence Reed of Foundation for Economic Education
In this episode of WichitaLiberty.TV. Lawrence W. Reed, who is president of the Foundation for Economic Education.
-

Kansas and Arizona schools
Arizona shows that Kansas is missing out on an opportunity to provide better education at lower cost.
-
Public school experts
Do only those within the Kansas public schooling community have a say?