Tag: Featured
-
WichitaLiberty.TV: Confusion about corruption in Wichita, regulation in Wichita, and the lowly pencil
Citizen activists were concerned about unleashing a corrupting influence in Wichita City Hall, but they didn’t know it’s already there. Then, the regulatory landscape in Wichita. Finally, what can a pencil teach us about how the world works?
-

Regulation in Wichita, a ‘labyrinth of city processes’
Wichita offers special regulatory treatment for special circumstances, widening the gulf between the haves and have-nots.
-

Sedgwick County Zoo
Since funding for and management of the Sedgwick County Zoo is in the news, here are some articles showing how generous the county has been with funding.
-
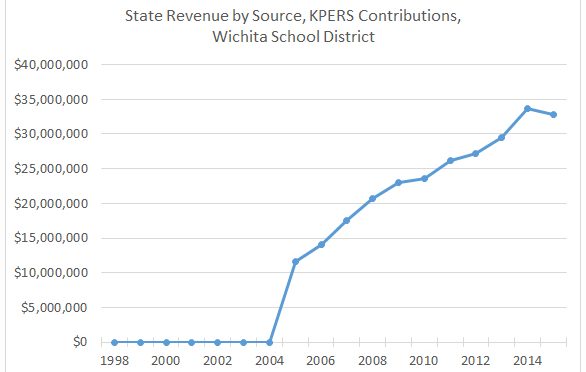
KPERS payments and Kansas schools
There is a claim that a recent change in the handling of KPERS payments falsely inflates school spending. The Kansas State Department of Education says otherwise.
-
WichitaLiberty.TV: Charter schools in Kansas, and a victory for speech and association
In this episode of WichitaLiberty.TV: Kansas has essentially no charter schools. Here’s why we need them. AFP Foundation scores a victory for free speech and association. Episode 120, broadcast June 5, 2016.
-

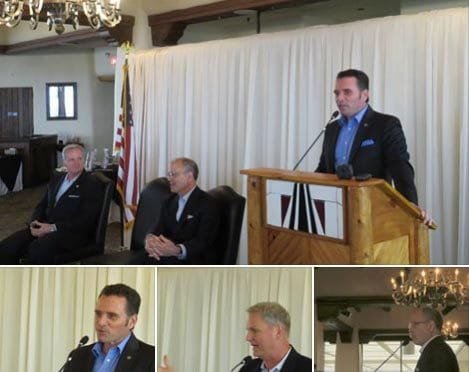
Kansas senate candidate forum
At the Wichita Pachyderm Club this week: A candidate forum for Republican Candidates for Kansas Senate, districts 27 and 31.
-

Wichita water statistics update
The Wichita ASR water project produced little water during the first four months of 2016. There were many days when river flow was adequate.
-
At Pachyderm: Legislative wrapup
Rep. Mark Kahrs, Rep. Marc Rhoades, and Sen. Ty Masterson briefed the Wichita Pachyderm Club on the 2016 session of the Kansas Legislature.
-
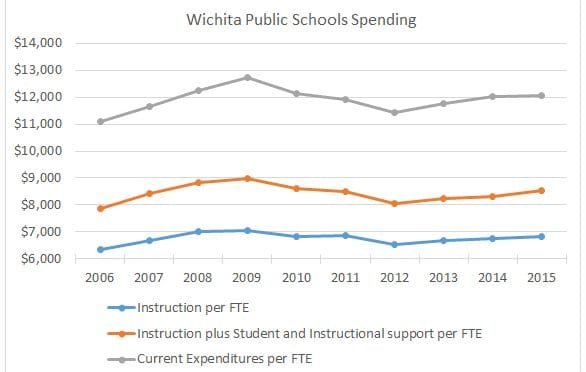
Wichita school spending
Spending by the Wichita public school district, adjusted for inflation and enrollment.
-
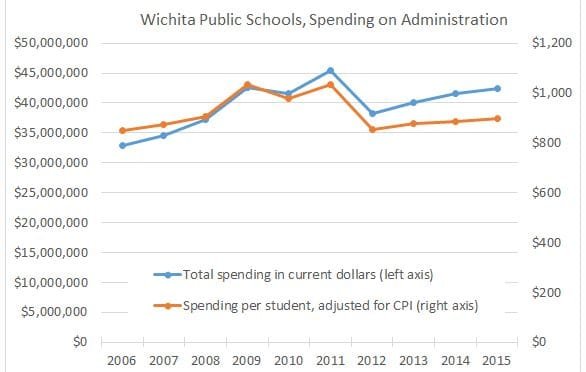
Wichita school district spending on administration
Could the Wichita public school district reduce spending on administration to previous levels?
-
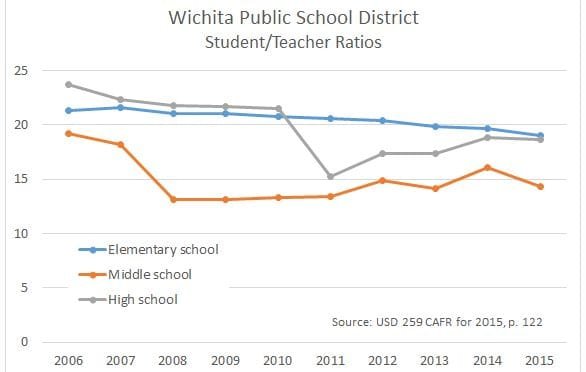
Wichita student/teacher ratios
Despite years of purported budget cuts, the Wichita public school district has been able to improve its student/teacher ratios.
-

At Pachyderm: Chapman Rackaway on the Kansas primary elections
Professor Chapman Rackaway of Fort Hays State University briefed members and guests of the Wichita Pachyderm Club on the August primary elections.