Tag: Featured
-

Inspector General evaluates Obamacare website
The HHS Inspector General has released an evaluation of the Obamacare website HealthCare.gov, shedding light on the performance of former Kansas Governor Kathleen Sebelius.
-

Massage business regulations likely to be ineffective, but will be onerous
The Wichita City Council is likely to create a new regulatory regime for massage businesses in response to a problem that is already addressed by strict laws.
-
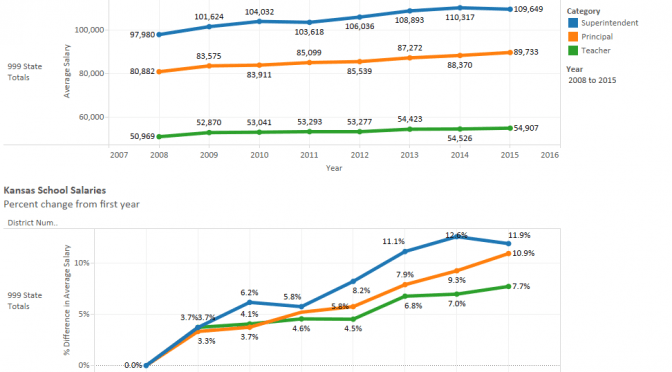
Kansas school salaries
Kansas school salaries for superintendents, principals, and teachers presented in an interactive visualization for each district.
-
David Bobb: Free speech and its importance
David Bobb, President of The Bill of Rights Institute, explains freedom of speech and its importance.
-
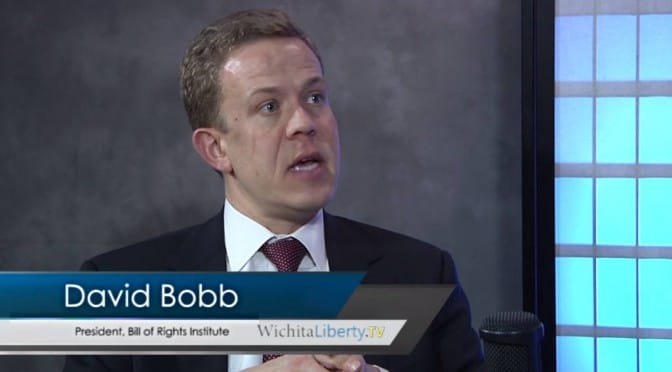
WichitaLiberty.TV: David Bobb, President of Bill of Rights Institute
In this episode of WichitaLiberty.TV: David Bobb, President of The Bill of Rights Institute, talks about civic education and the importance of humility.
-

Debate: The National Debt
This is an audio recording of a debate on the theme “Should the U.S. implement austerity measures due to the national debt?”
-

WichitaLiberty.TV: Radio talk show host Joseph Ashby
In this episode of WichitaLiberty.TV: Radio talk show host Joseph Ashby visits the KGPT studios to explain presidential politics.
-

Kansas transportation bonds economics worse than told
The economic details of a semi-secret sale of bonds by the State of Kansas are worse than what’s been reported.
-

This is why we must eliminate defined-benefit public pensions
Actions considered by the Kansas Legislature demonstrate — again — that governments are not capable of managing defined-benefit pension plans.
-
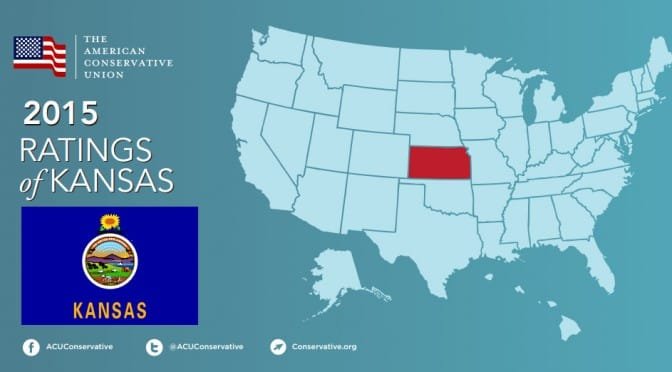
ACU rates the Kansas Legislature
The American Conservative Union has released its ratings for the 2015 Kansas Legislature.
-
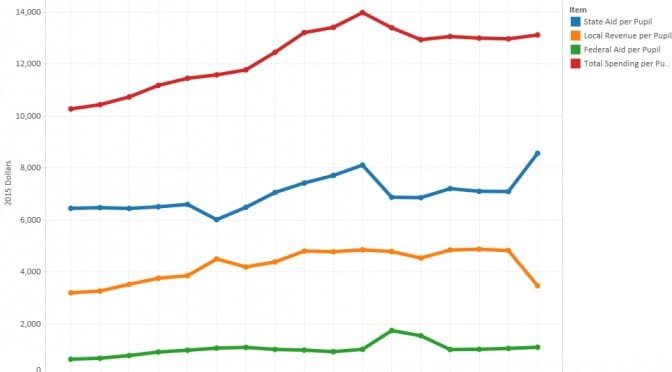
Kansas school spending: Visualization
An interactive visualization of revenue and spending data for Kansas school districts.
-
WichitaLiberty.TV: Journalist, novelist, and blogger Bud Norman on presidential politics
In this episode of WichitaLiberty.TV: Journalist, novelist, and blogger Bud Norman joins host Bob Weeks to discuss presidential election politics.