Tag: Kansas Association of School Boards
-

Survey finds Kansans with little knowledge of school spending
As in years past, a survey finds that when Kansans are asked questions about the level of school spending, few have the correct information.
-
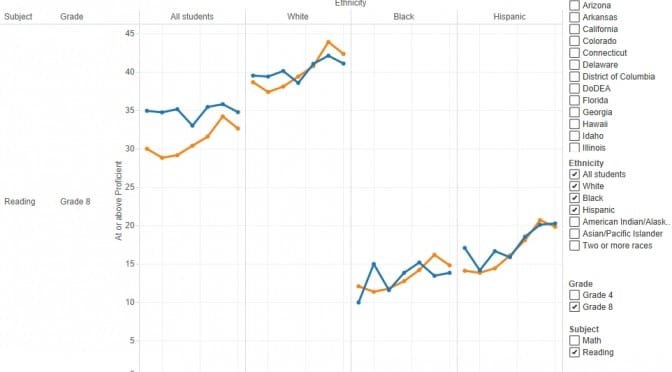
Kansas NAEP scores for 2015
Reactions to the release of National Assessment of Educational Progress scores for Kansas and the nation. Also, an interactive visualization.
-

Kansas school funding growing faster than inflation
Kansas school funding has been growing much faster inflation and enrollment, but for some, it will never be enough, and they will continue to use taxpayer money to press their monetary demands, writes Dave Trabert of Kansas Policy Institute.
-
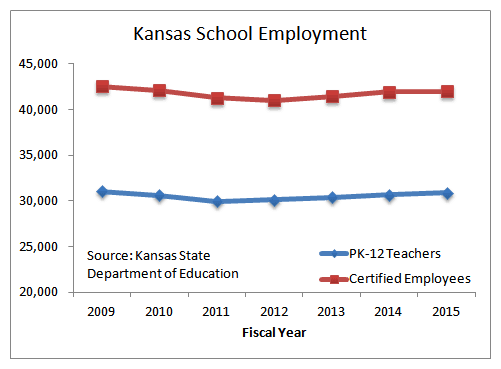
Kansas school employees, the trend
The trend in Kansas public school employment and teacher/pupil ratios may surprise you, given the narrative presented by public schools.
-

For Kansas schools, a share of your income is the standard
If Kansas personal income rises but the school spending establishment doesn’t get its cut, something is wrong, they say.
-
School boards in Kansas
Mark Tallman, associate executive director for advocacy at Kansas Association of School Boards addressed members and guests of the Wichita Pachyderm Club on January 9, 2015. The slides from his presentation are below. [gview file=”http://wichitaliberty.org/wp-content/uploads/2015/01/School-Boards-in-Kansas-Mark-Tallman-2015-01-09.pdf”]
-
For McGinn, a liberal voting record is a tradition
Based on votes made in the Kansas Senate, the advertising claims of Sedgwick County Commission candidate Carolyn McGinn don’t match her record.
-
Kansas school finance reporting and opinion
Kansas school finance reporting and opinion
-

In Kansas, education is all about money and politics for UMEEA
Media reaction to the school finance legislation has been pretty predictable, focusing almost exclusively on institutions and ignoring the impact on students, writes Dave Trabert of Kansas Policy Institute.
-

WichitaLiberty.TV: Kansas school finance lawsuit, problems solved?
The Kansas Supreme Court handed down its ruling in Gannon v. Kansas, the school finance lawsuit. What did the court say, and did it address the real and important issues with Kansas schools?
-
In Kansas, the Blob is worked up
In Kansas, we’re seeing the Blob at full activation, vigorously protecting its interests against school reforms.
-
Kansas education topic on ‘This Week in Kansas’
Kansas education issues were a topic on a recent segment of KAKE TV “This Week in Kansas.”