Tag: Kansas State Department of Education
-
CBPP on Kansas schools and taxes, part 2
Kansas policy Institute continues to investigate claims made by Center on Budget and Policy Priorities about Kansas schools and taxes.
-

In Kansas, education is all about money and politics for UMEEA
Media reaction to the school finance legislation has been pretty predictable, focusing almost exclusively on institutions and ignoring the impact on students, writes Dave Trabert of Kansas Policy Institute.
-
Kansas values, applied to schools
A Kansas public policy advocacy group makes an emotional pitch to petition signers, but signers should first be aware of actual facts.
-

Kansas Policy Institute at work
A recap of what Kansas Policy institute has done the past few years leaves me to wonder how anyone who cares about Kansas schoolchildren could be opposed to the work KPI has done.
-

In Kansas, base state aid is only a small part of spending
Considering only base state aid per pupil leads to an incomplete understanding of school spending in Kansas. The Gannon school finance decision reinforces this.
-

WichitaLiberty.TV: Kansas school finance lawsuit, problems solved?
The Kansas Supreme Court handed down its ruling in Gannon v. Kansas, the school finance lawsuit. What did the court say, and did it address the real and important issues with Kansas schools?
-

Kansas school employment: Mainstream media notices
When two liberal newspapers in Kansas notice and report the lies told by a Democratic candidate for governor, we know there’s a problem.
-
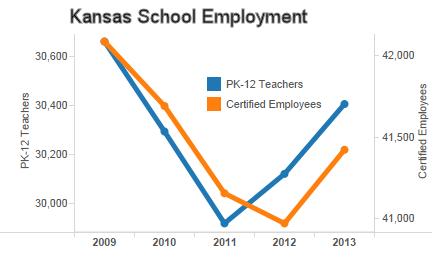
Kansas school employment: The statistics and the claims
Claims made about Kansas schools don’t match the state’s statistics
-
Voice for Liberty Radio: Mike O’Neal, Kansas Chamber of Commerce
In this episode of WichitaLiberty Podcasts: Mike O’Neal, who is president and CEO of the Kansas Chamber of Commerce, spoke yesterday to the Wichita Pachyderm Club. A large part of his talk was on the topic of Kansas school finance and other education topics. This podcast contains that portion of his speech.
-
Kansas school employment: The claims compared to statistics
Claims made about Kansas schools don’t match the state’s statistics.
-
LOB property tax increase already in effect
Kansas school finance issues explained from Kansas Policy Institute.
-
Kansas school test scores, in perspective
When comparing Kansas school test scores to those of other states, it’s important to consider disaggregated data. Otherwise we may — figuratively speaking — let the forest obscure the trees.