Tag: Sam Brownback
-

Kansas school teacher cuts, student ratios
What has been the trend in Kansas school employment and pupil-teacher ratio?
-
Governor vote in Sedgwick County, November 4, 2014
Here’s a map I created of the vote percentage Governor Sam Brownback received by precinct.
-
Elections in Kansas: Federal offices
Kansas Republican primary voters made two good decisions this week.
-
Wolf investigation, political to the extreme
The investigation of a candidate for United States Senator by an appointed board in Kansas raises questions of propriety, and Senator Pat Roberts’ use of it in advertising is shameful.
-

Women for Kansas voting guide should be read with caution
If voters are relying on a voter guide from Women for Kansas, they should consider the actual history of Kansas taxation and spending before voting.
-

For Rep. Tiahrt, Cash for Clunkers was a good spending program
When the Obama Administration needed additional funds for the Cash for Clunkers program, Todd Tiahrt was agreeable to funding this wasteful program.
-
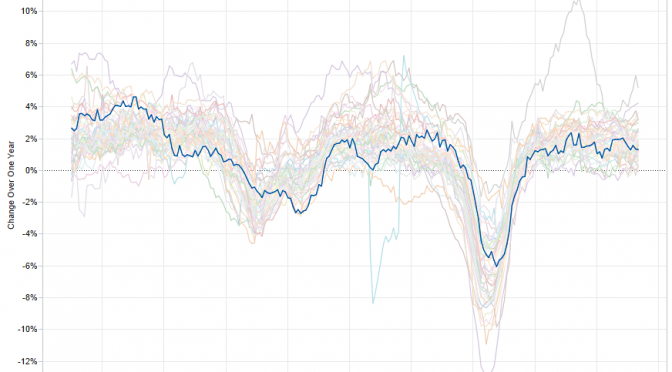
Job growth in the states and Kansas
Let’s ask critics of current Kansas economic policy if they’re satisfied with the Kansas of recent decades.
-
Myth: The Kansas tax cuts haven’t boosted its economy
While tax reform hasn’t produced the “shot of adrenaline” predicted by Governor Brownback, the problem is one of political enthusiasm rather than economics, writes Dave Trabert of Kansas Policy Institute.
-
Kansas school finance reporting and opinion
Kansas school finance reporting and opinion
-

Kansas school finance lawsuit reaction
News coverage and reaction to the Kansas school finance lawsuit Luke Gannon, et al v. State of Kansas.
-
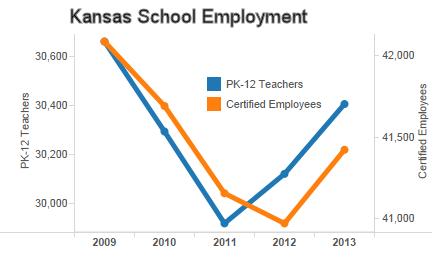
Kansas school employment: The statistics and the claims
Claims made about Kansas schools don’t match the state’s statistics