Tag: Visualizations
-
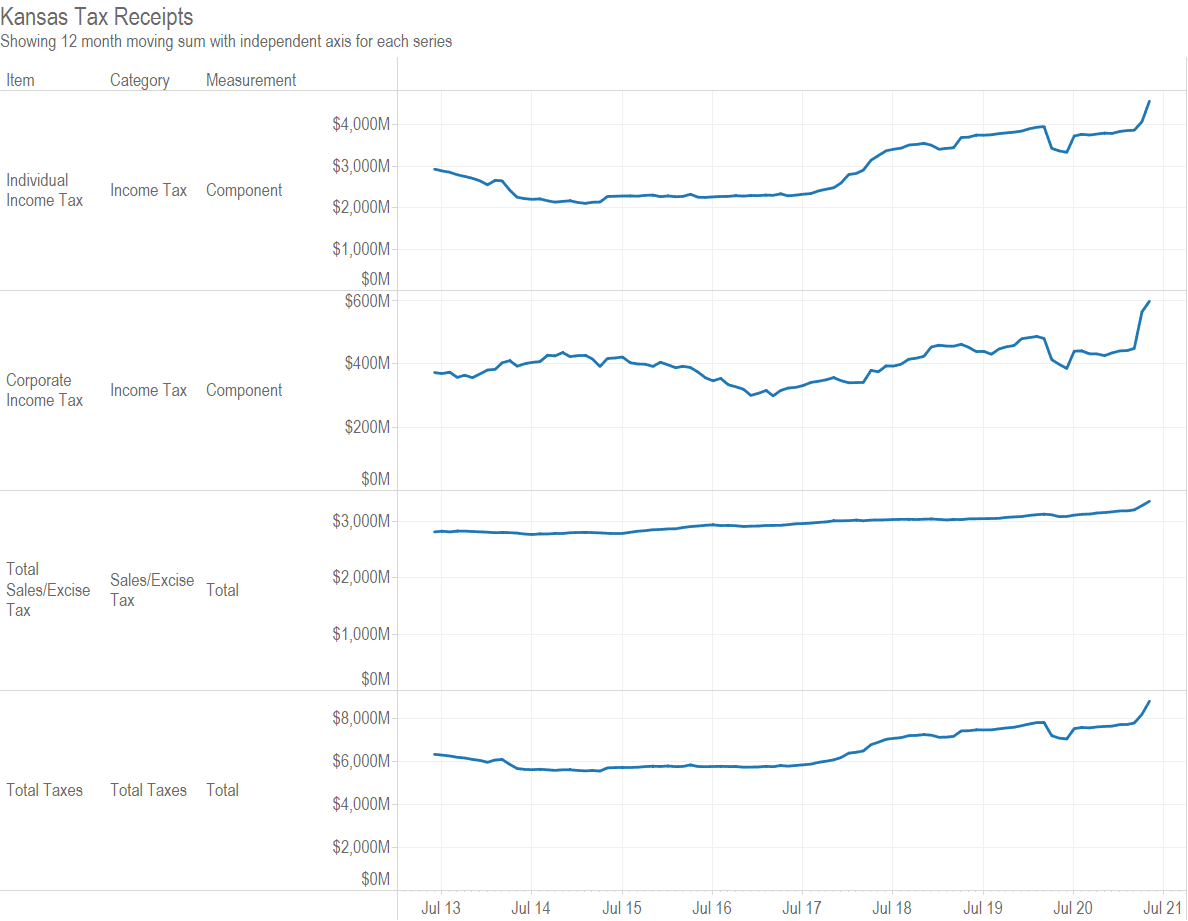
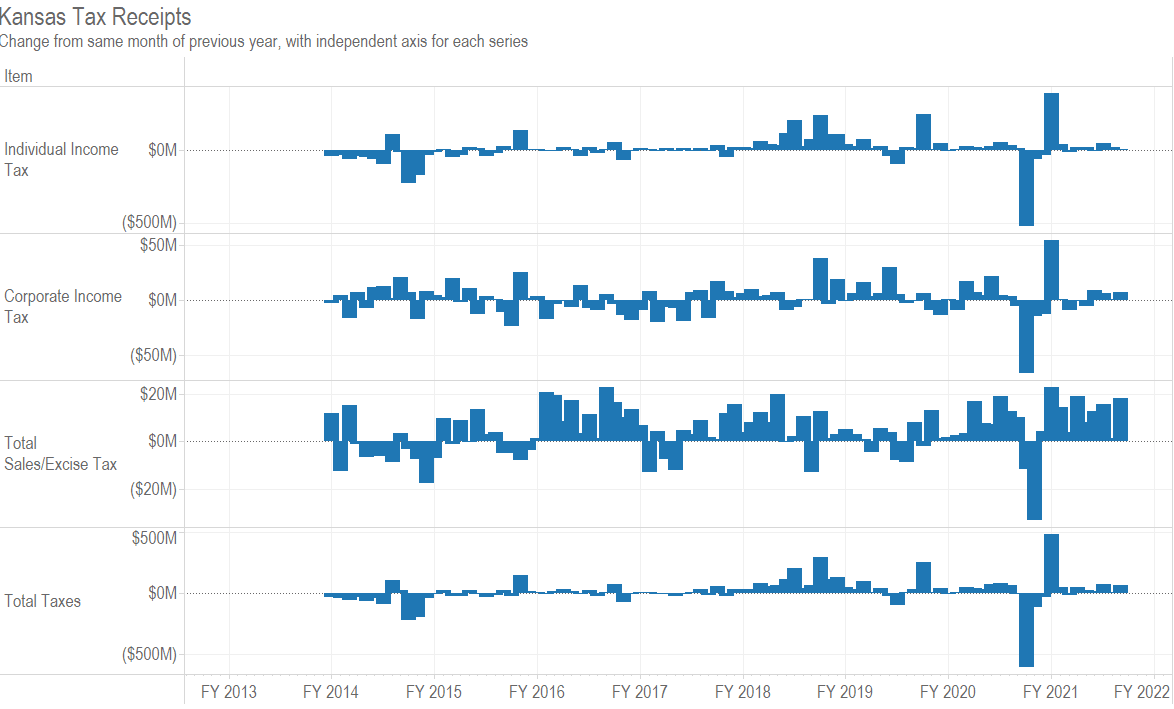
Kansas tax revenue, May 2021
For May 2021, Kansas tax revenue was 134.7 percent greater than May 2020. Over the eleven months of the current fiscal year, revenue is 27.7 percent higher than at the same point of the previous year. There are important caveats to consider.
-
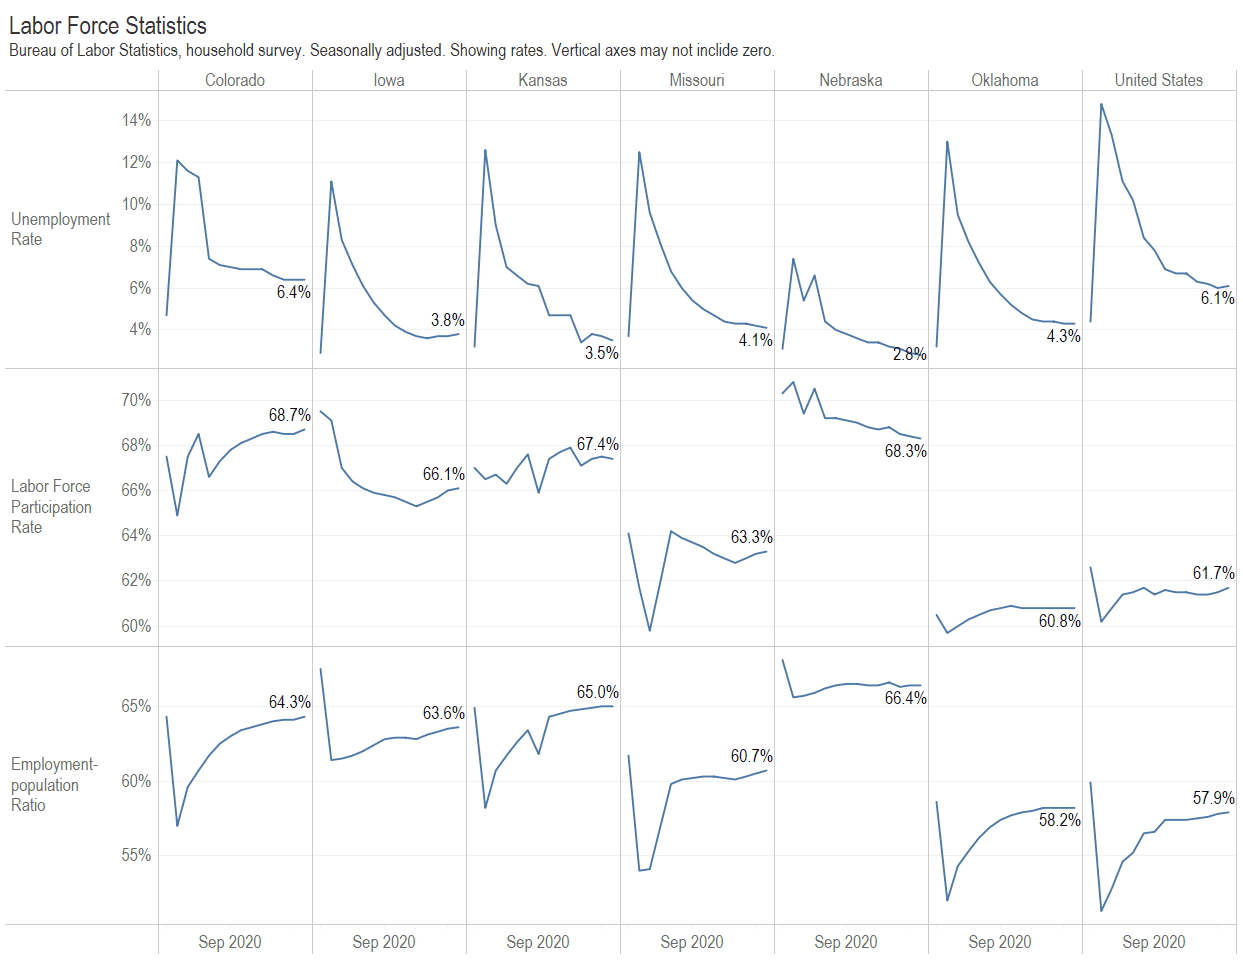
Kansas since the start of the pandemic
How has Kansas fared since the start of the pandemic compared to other states and the nation?
-
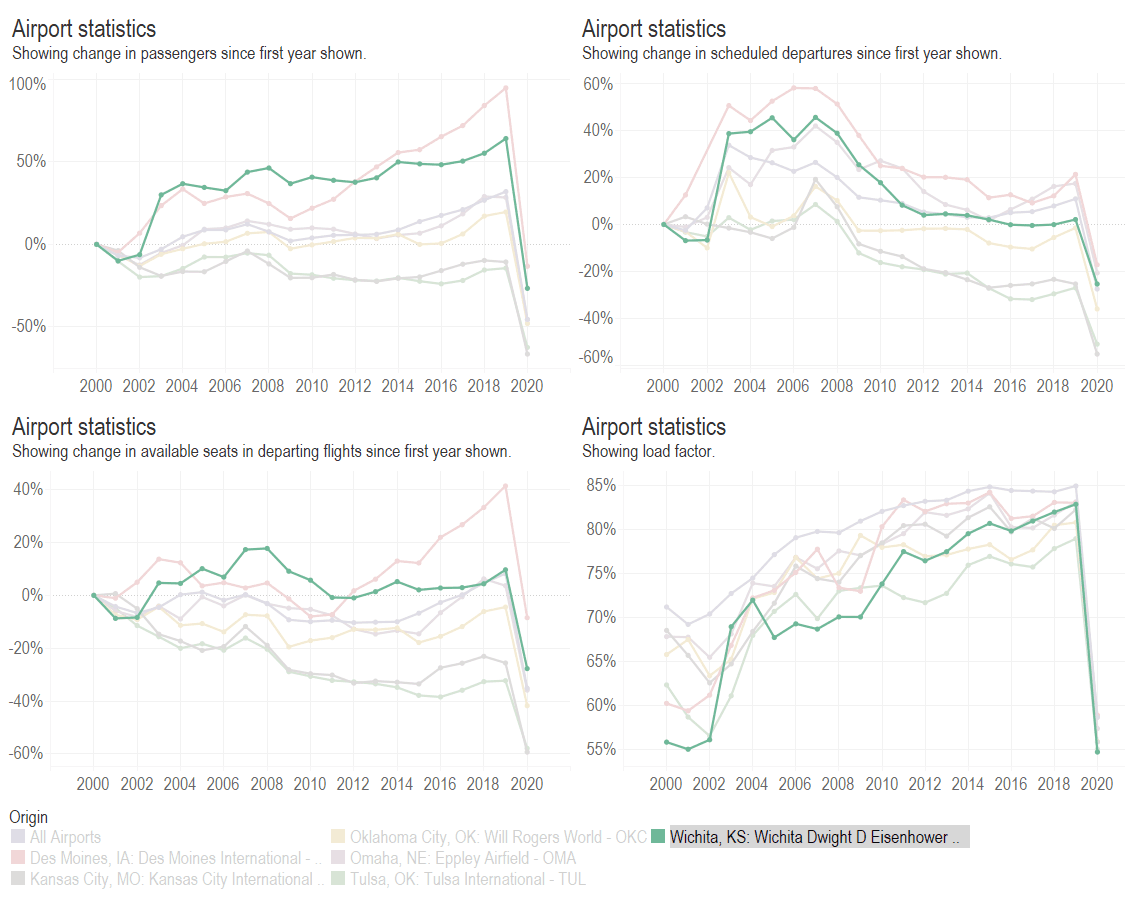
Airport traffic statistics, 2020
Airport traffic data presented in an interactive visualization, updated through 2020.
-
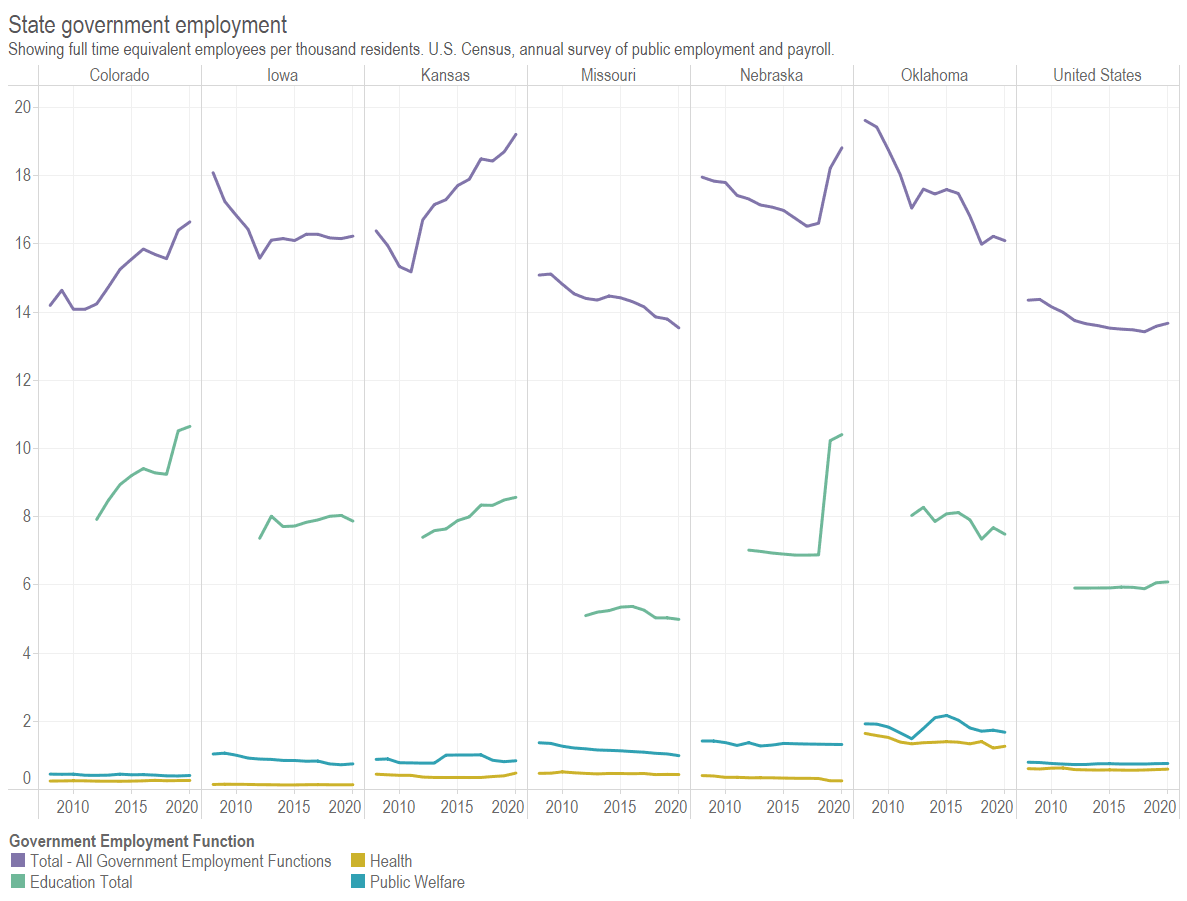
State government employees in Kansas
Kansas has more state government employees per resident than most states, and the trend is rising.
-
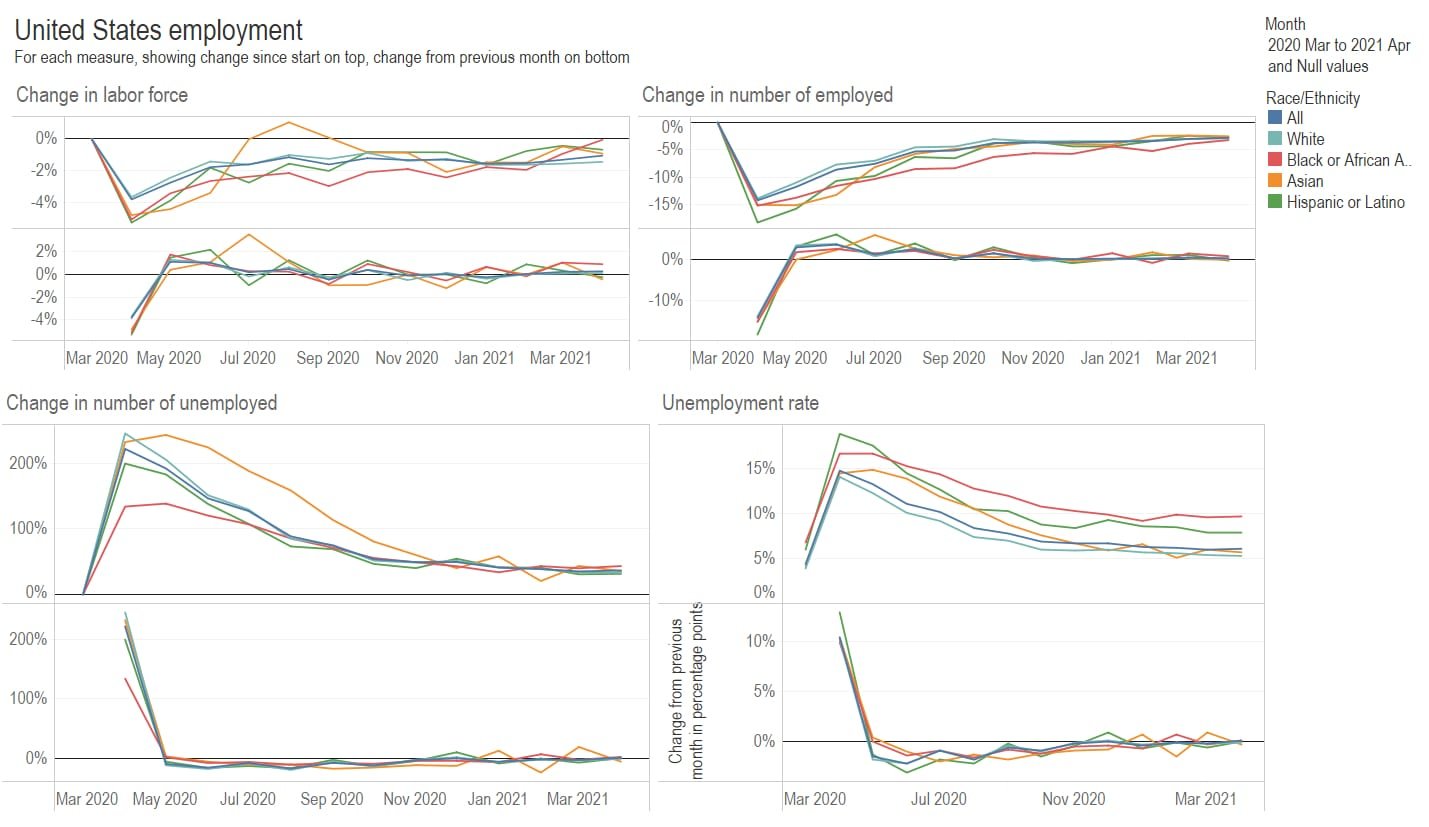
National employment, April 2021
The national jobs report for April underperformed expectations and the unemployment rate rose slightly. The March jobs figure was revised downward significantly.
-

Kansas tax revenue, April 2021
For April 2021, Kansas tax revenue was 69.9 percent greater than April 2020. Over the ten months of the current fiscal year, revenue is 19.5 percent higher than at the same point of the previous year. There are caveats to consider.
-
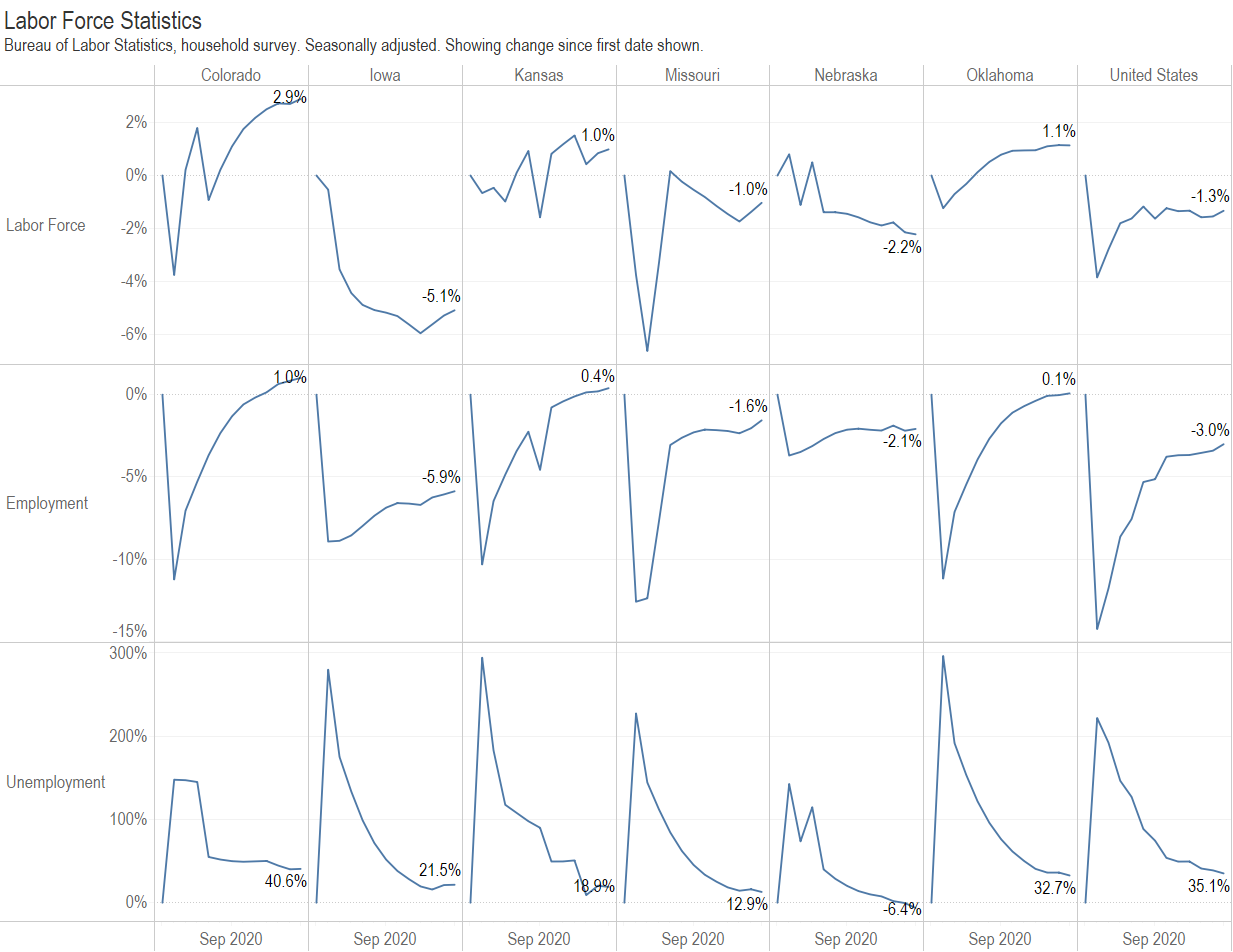
Kansas since the start of the pandemic
How has Kansas fared since the start of the pandemic compared to other states and the nation?
-
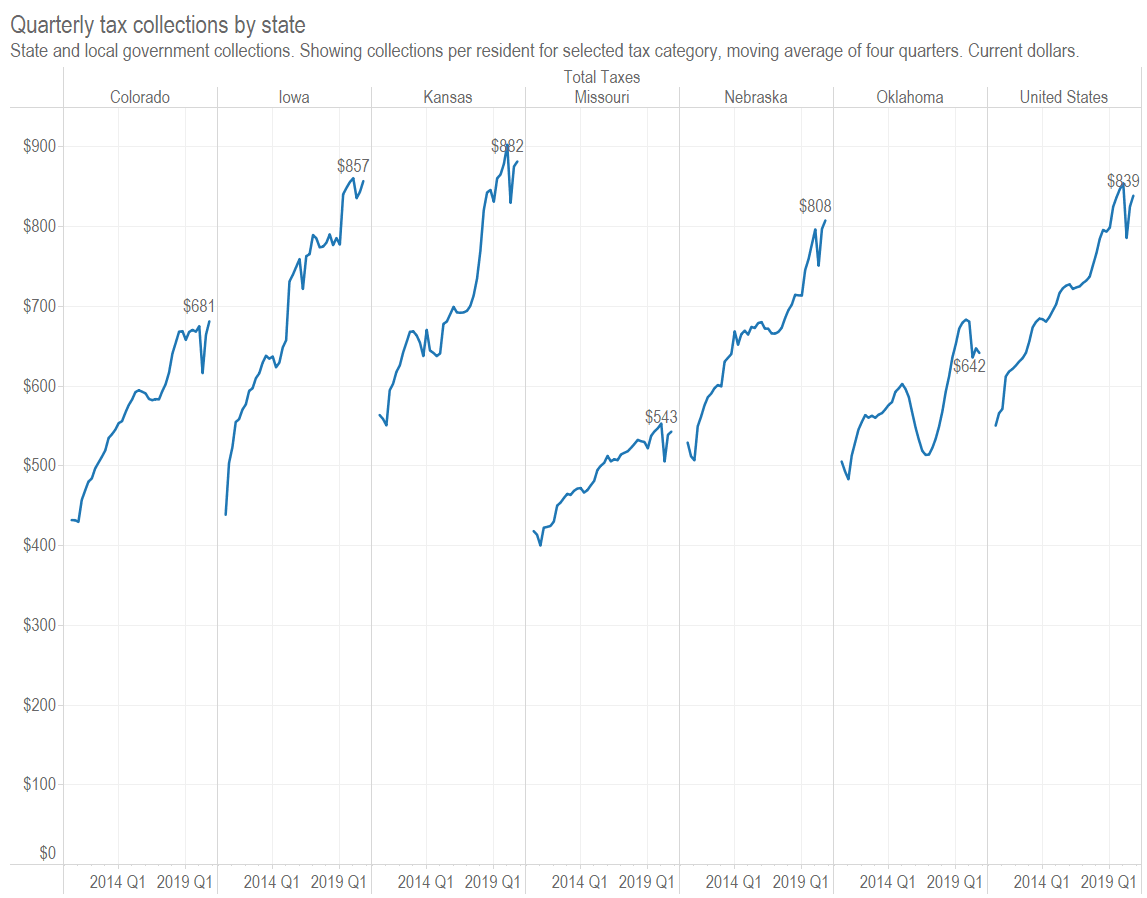
Quarterly tax collections
Tax collections by state and local governments fell by about one percent during calendar year 2020 when compared to the year before.
-
Kansas tax revenue, March 2021
For March 2021, Kansas tax revenue was 12.7 percent greater than March 2020. Over the nine months of the current fiscal year, revenue is 14.0 percent higher than at the same point of the previous year.
-

Kansas school spending
Kansas school district spending, updated through 2020 and adjusted for inflation.
-
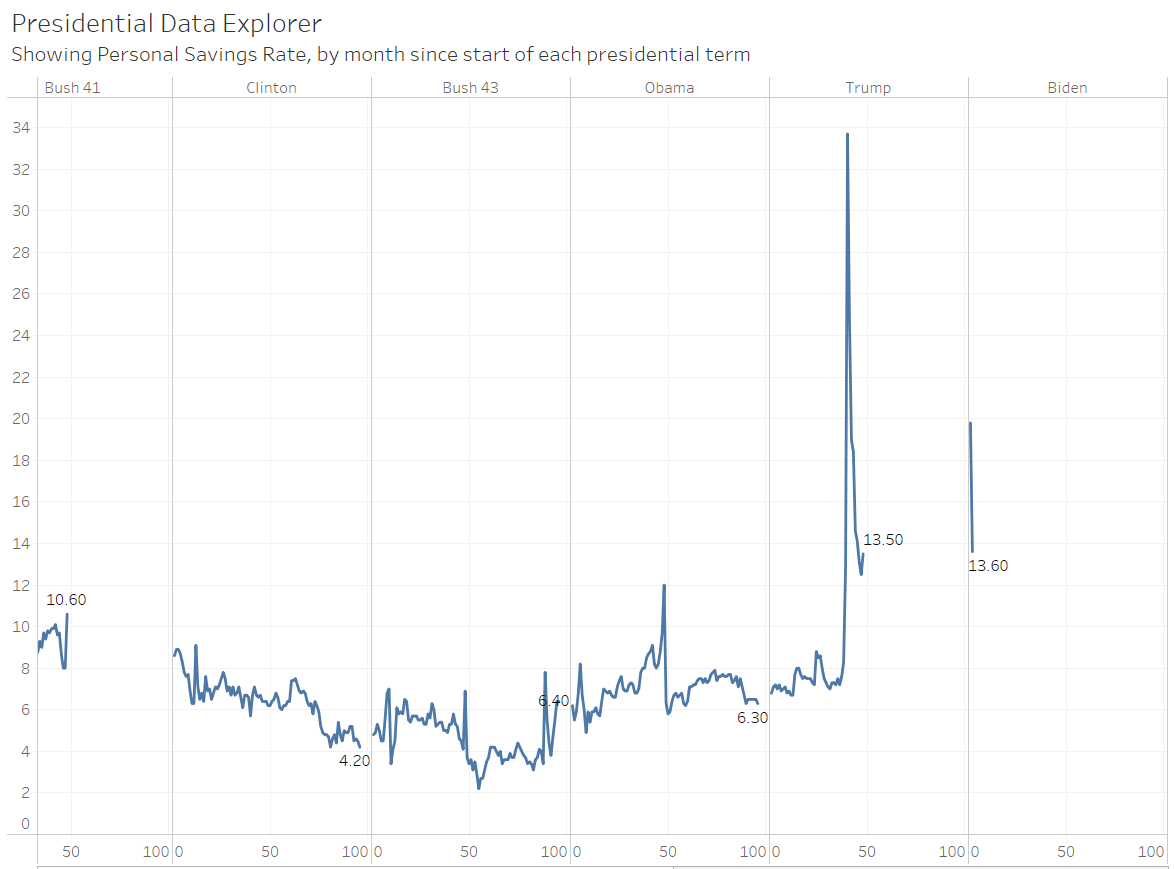
Updated: Presidential data explorer
Explore the economic record of presidents through the lens of data, with new updates for August.
-
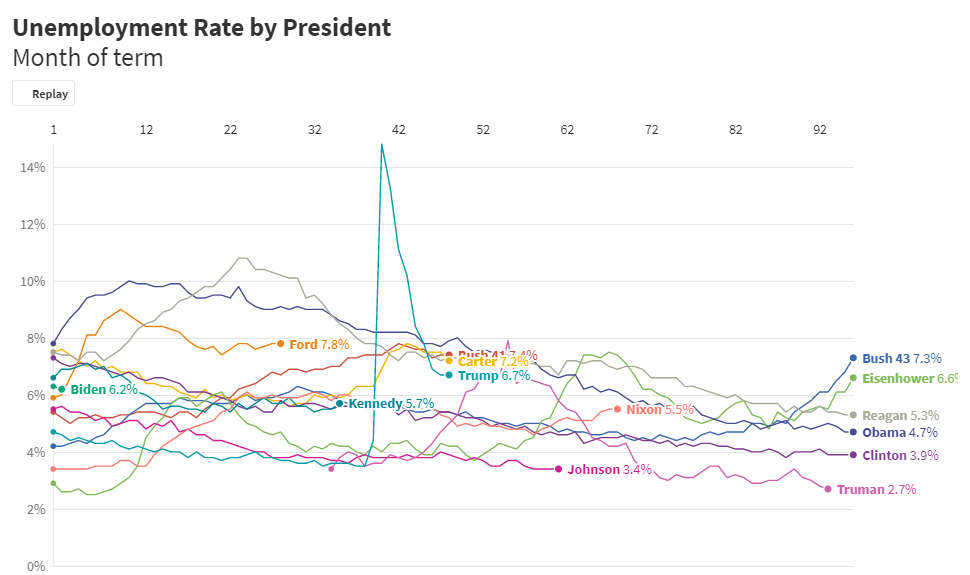
Unemployment by president
An interactive visualization of unemployment by presidential terms.