Tag: Visualizations
-
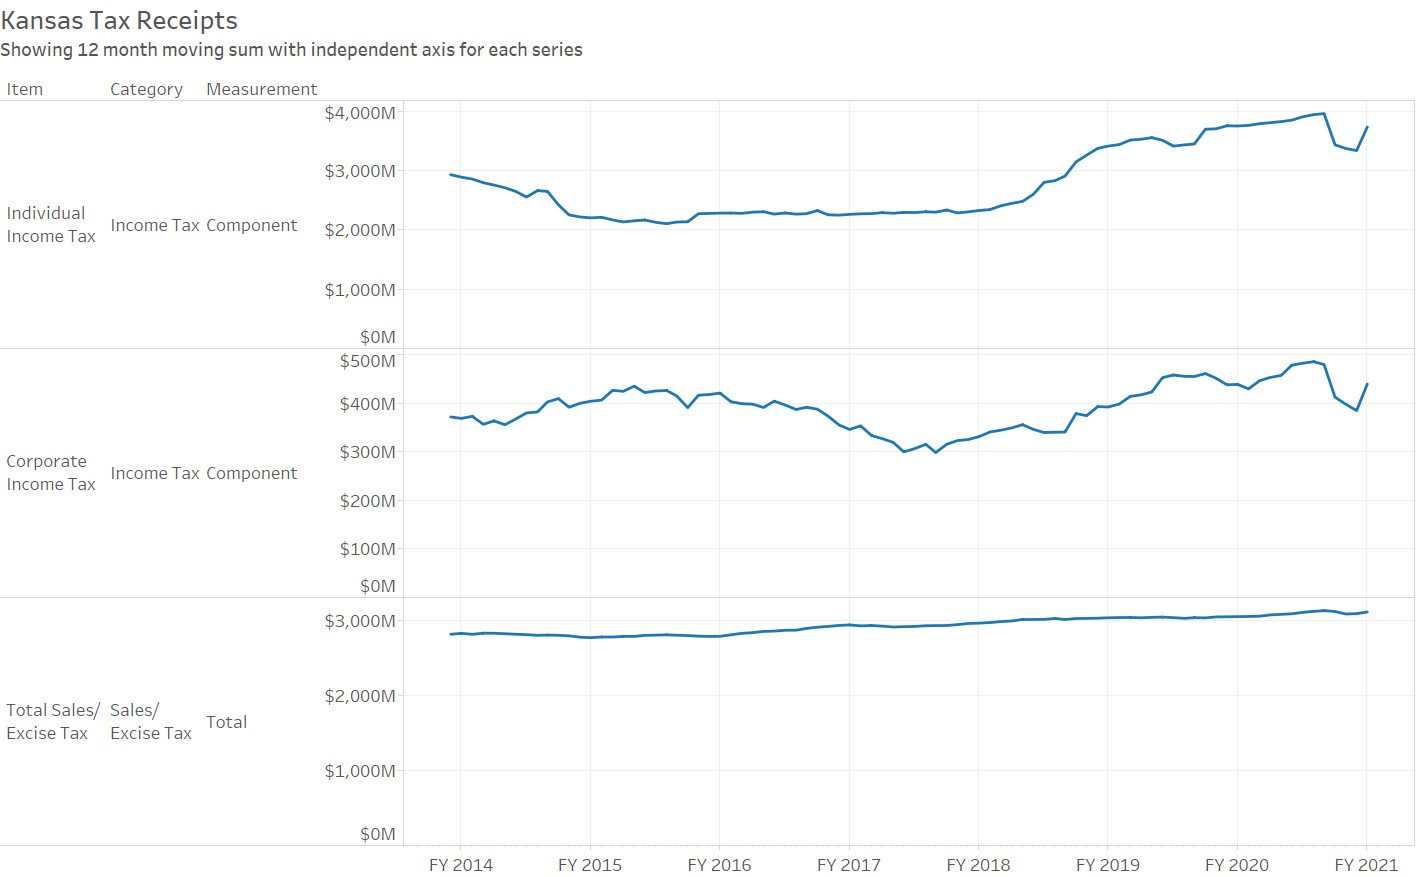
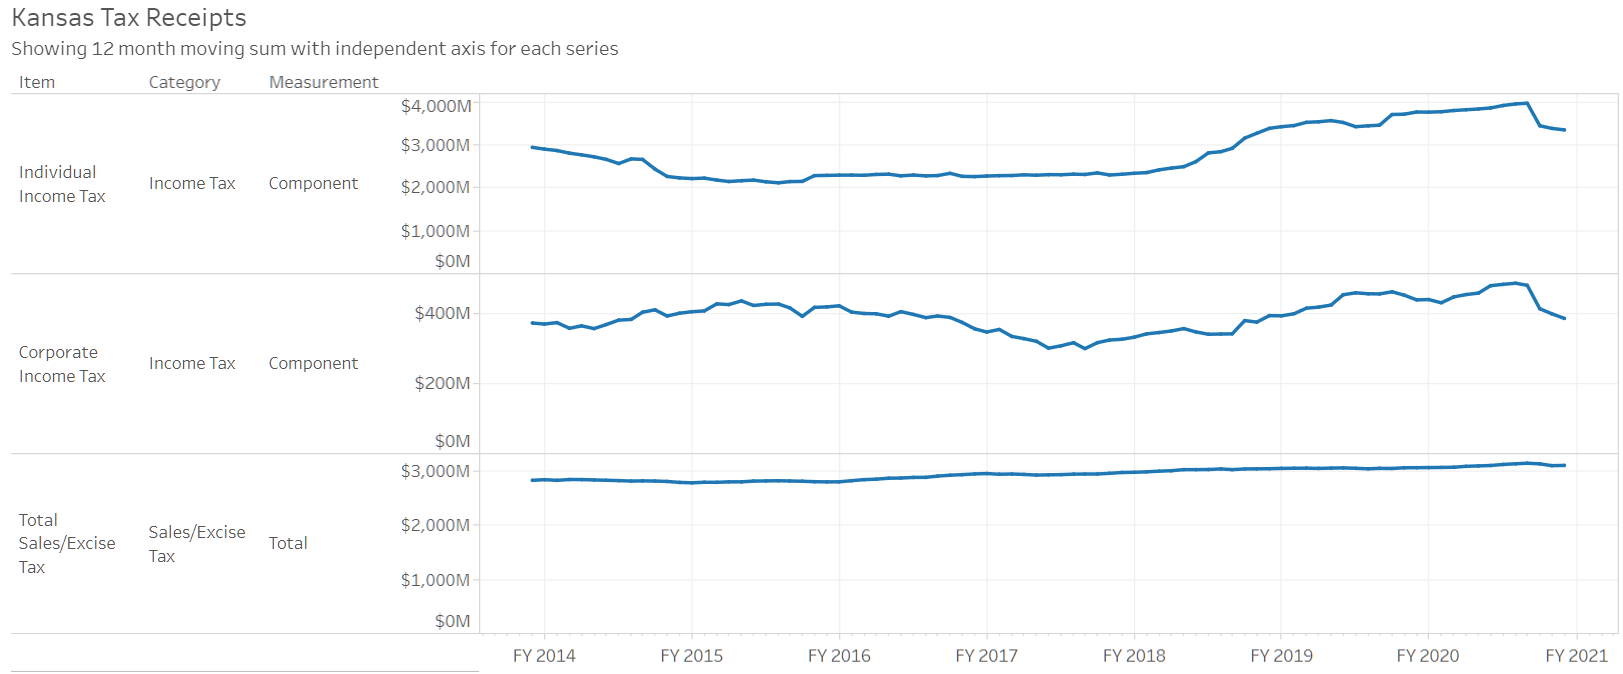
Kansas tax revenue, July 2020
For July 2020, total Kansas tax revenue rose by 97.7 percent from last July, reflecting the tax deadline postponement from April.
-
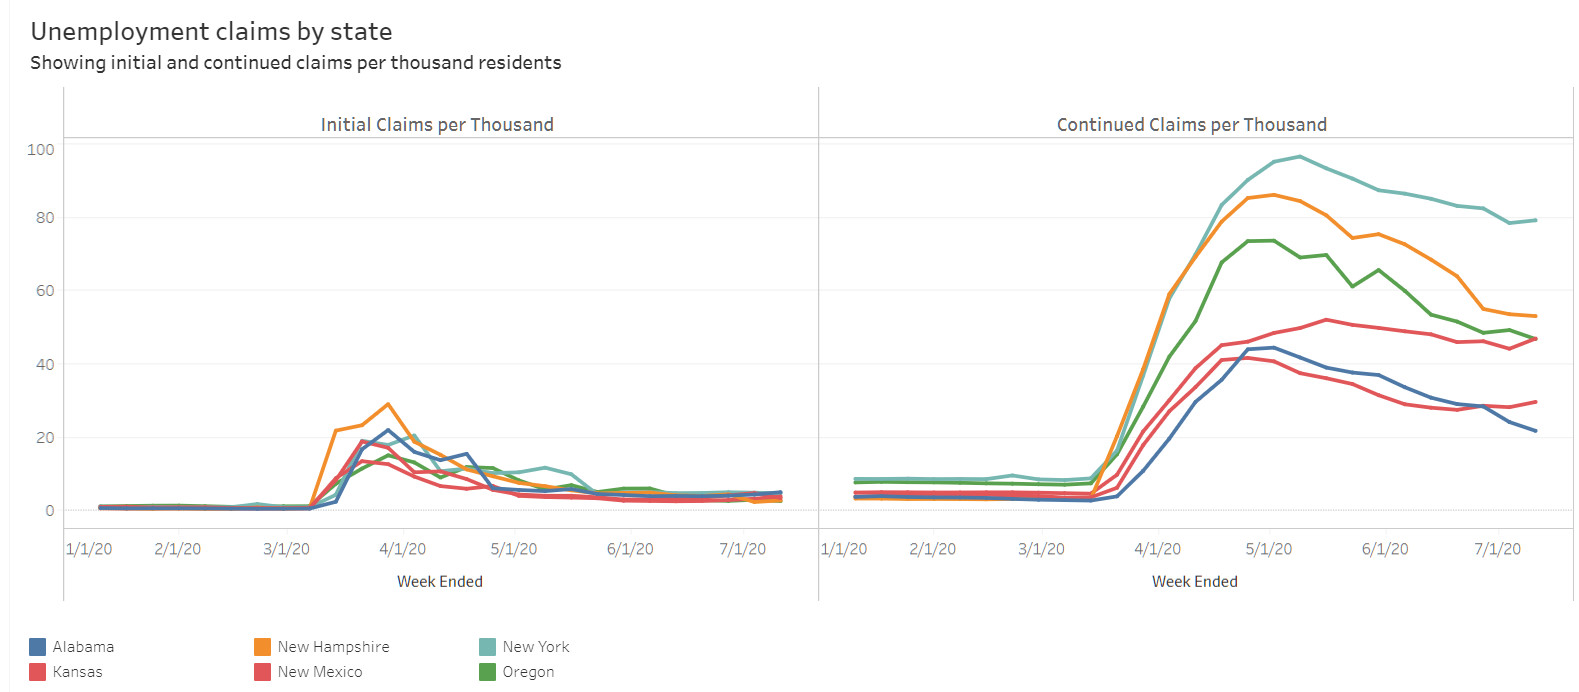
Unemployment claims by state
A visualization of unemployment insurance claims by state, adjusted for population.
-

Household income in the states
A visualization of household income by state, adjusted for inflation.
-

Federal revenue and outlays
An interactive visualization of federal government revenue and spending from 1962 to the present.
-

Effects of pandemic on employment in states
The effects of the response to the pandemic vary widely among the states, but federal government employment has been little affected.
-
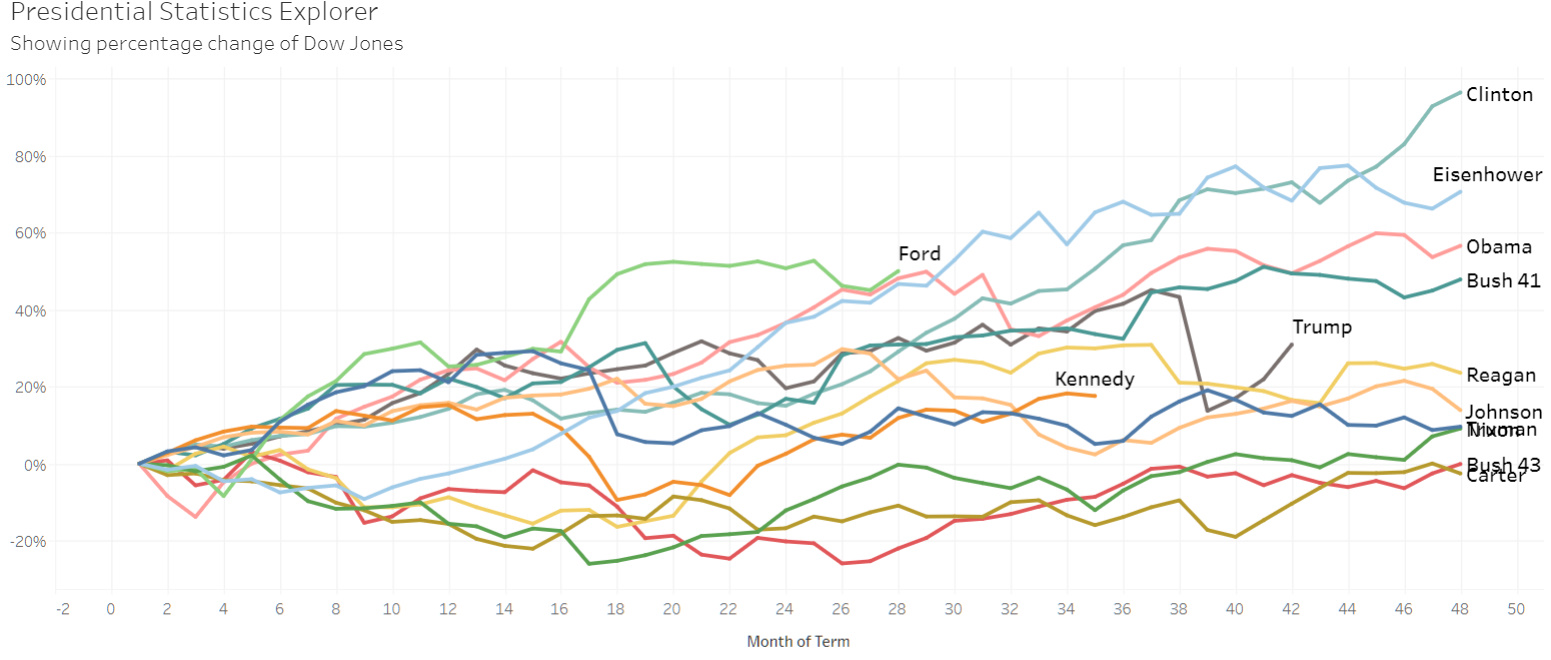
Presidential data explorer
Explore the economic record of presidents, starting with Harry S Truman.
-
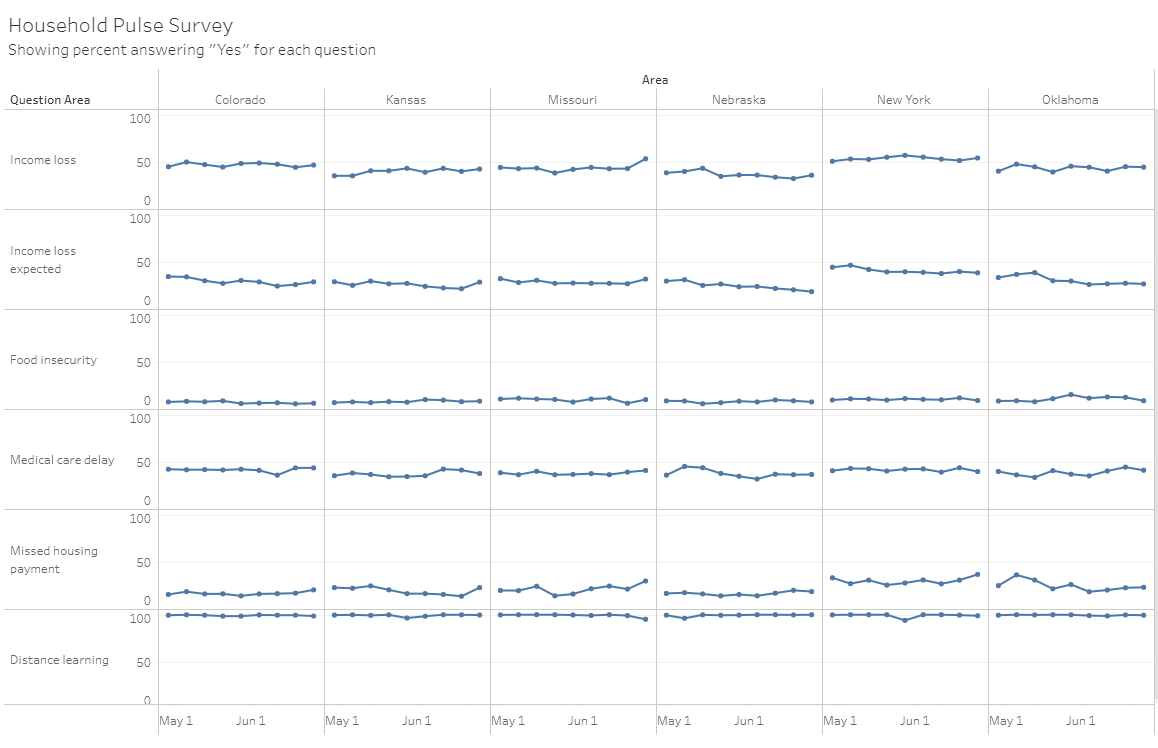
Measuring household experiences during the coronavirus (COVID-19) pandemic
An interactive visualization of household data on the effects of the pandemic.
-

Presidential jobs explorer
Explore the jobs creation record of presidents, starting with Harry S Truman.
-
Kansas tax revenue, June 2020
For June 2020, total Kansas tax revenue fell by 4.8 percent from last June. For the just-completed fiscal year 2020, revenue was down by 5.7 percent from the previous year.
-

Metropolitan employment and labor force
A visualization of employment, labor force, and the unemployment rate for metropolitan areas, now with data through May 2020.
-
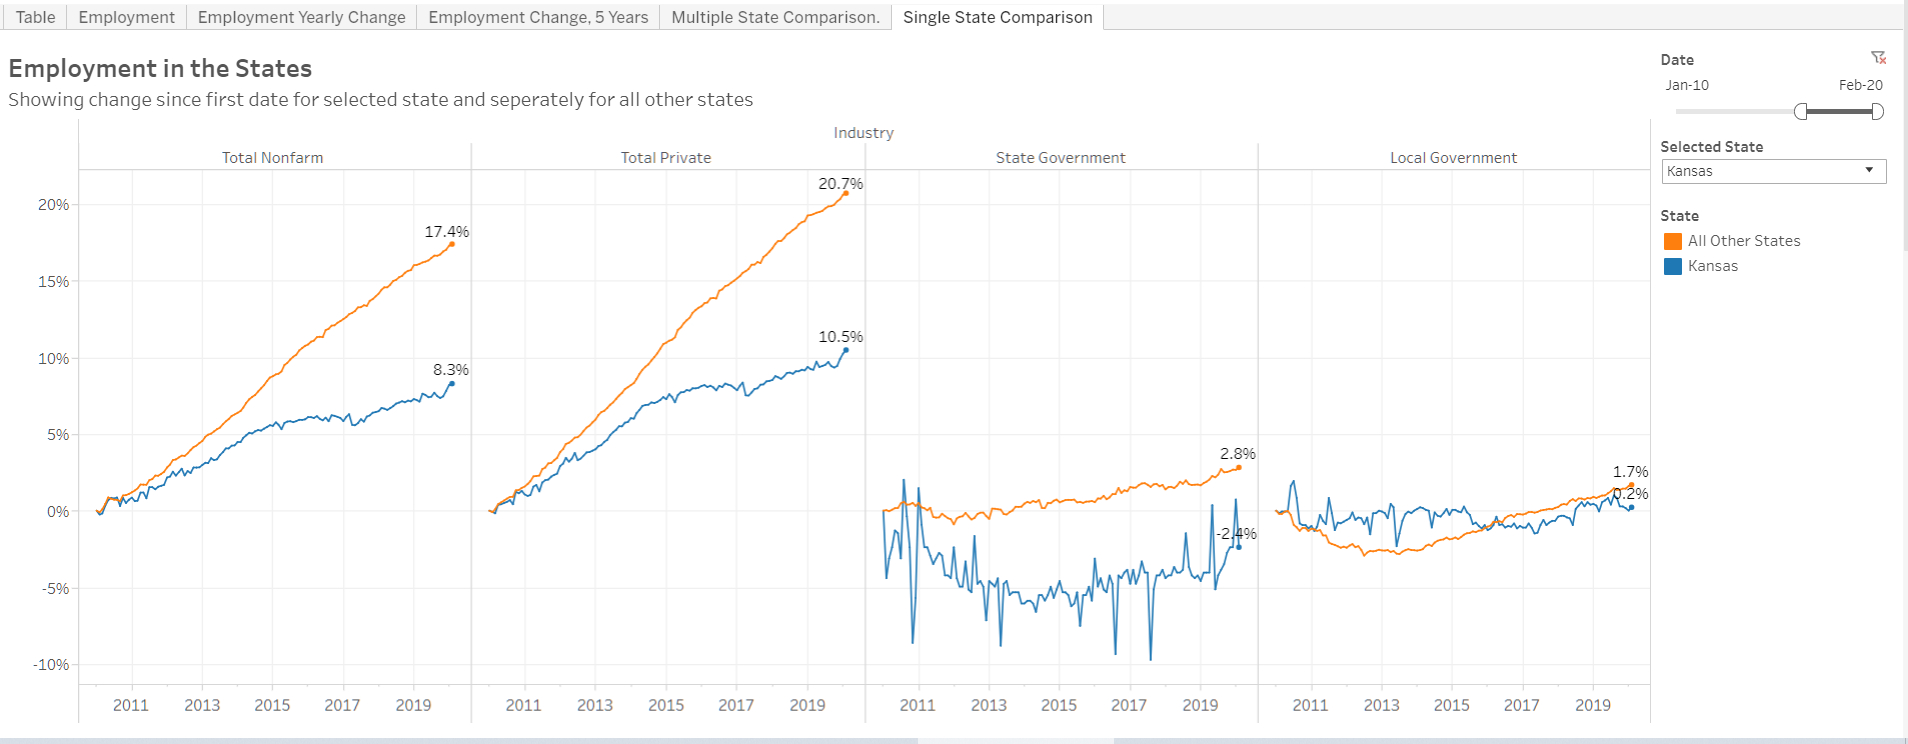
Employment in the states
An interactive visualization of monthly employment in the states by major industry category.
-
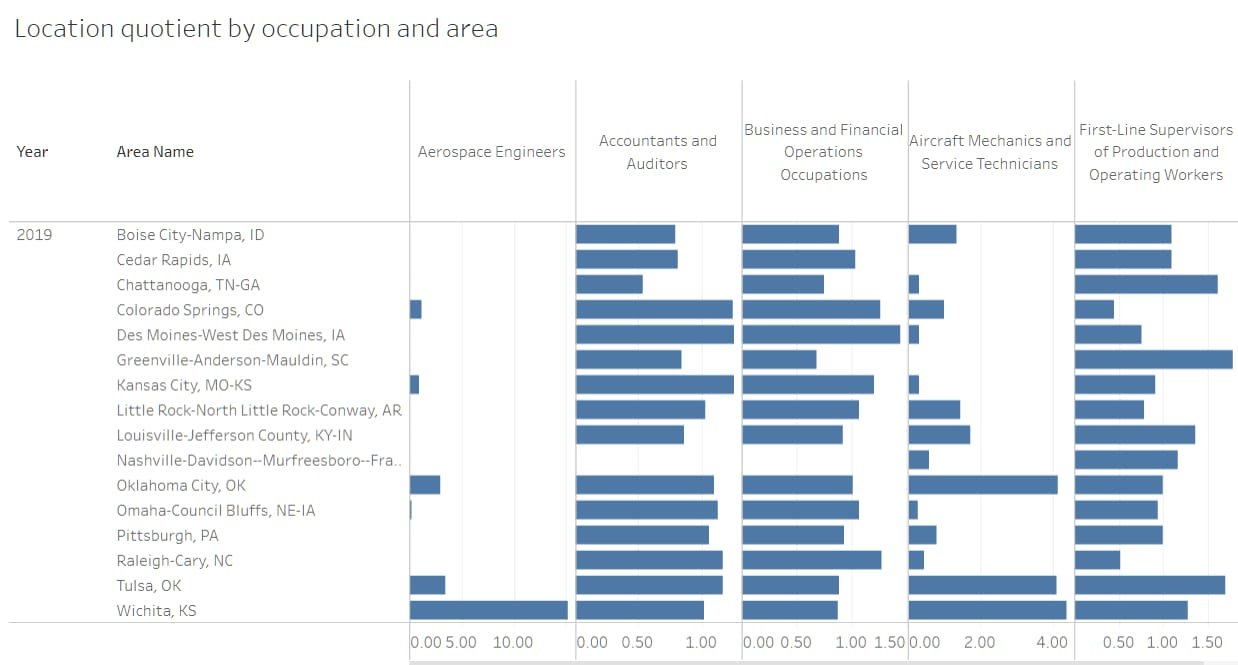
Occupational employment statistics
Salary data presented in an interactive visualization by occupation and by metropolitan area. Updated with data through 2019, and with additional data and charts.