Tag: Visualizations
-
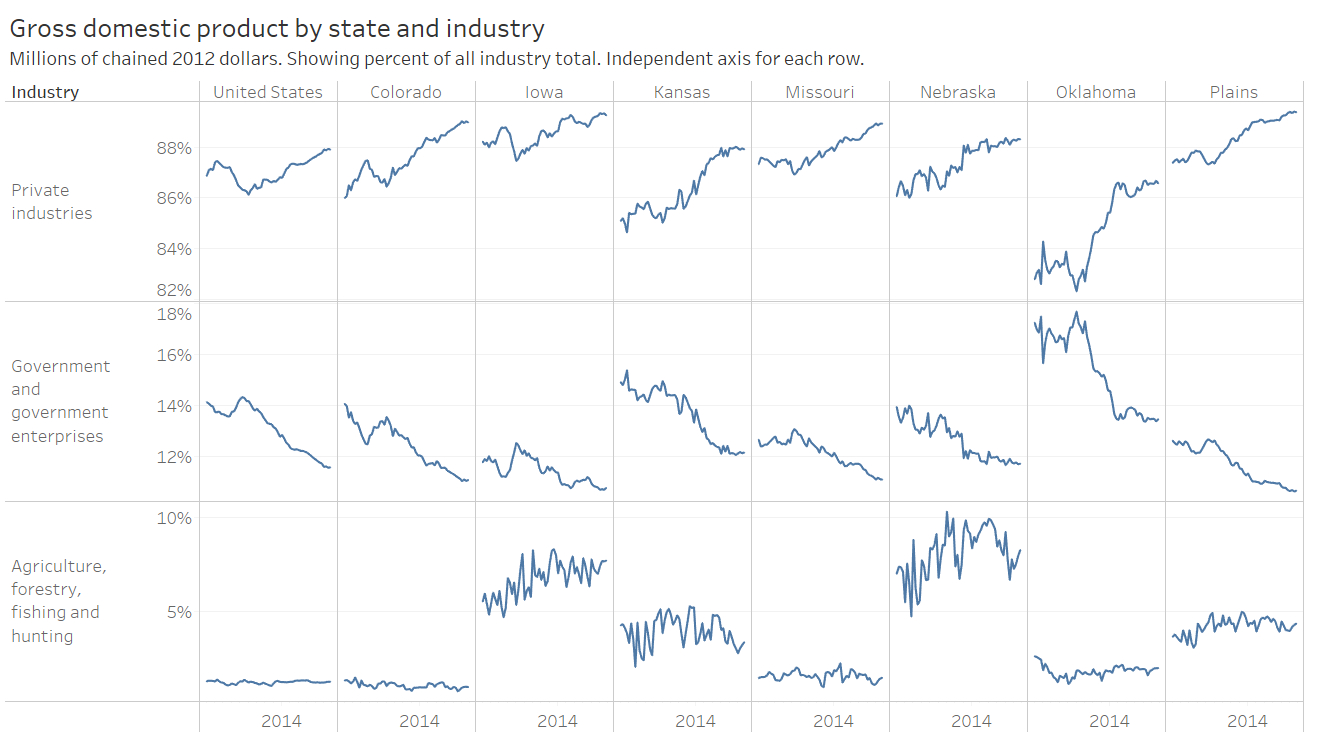
Quarterly Real GDP in Kansas
Examining changes in GDP and industry contribution in Kansas.
-

Kansas tax revenue, May 2020
For May 2020, total Kansas tax revenue fell by 20 percent from last May.
-
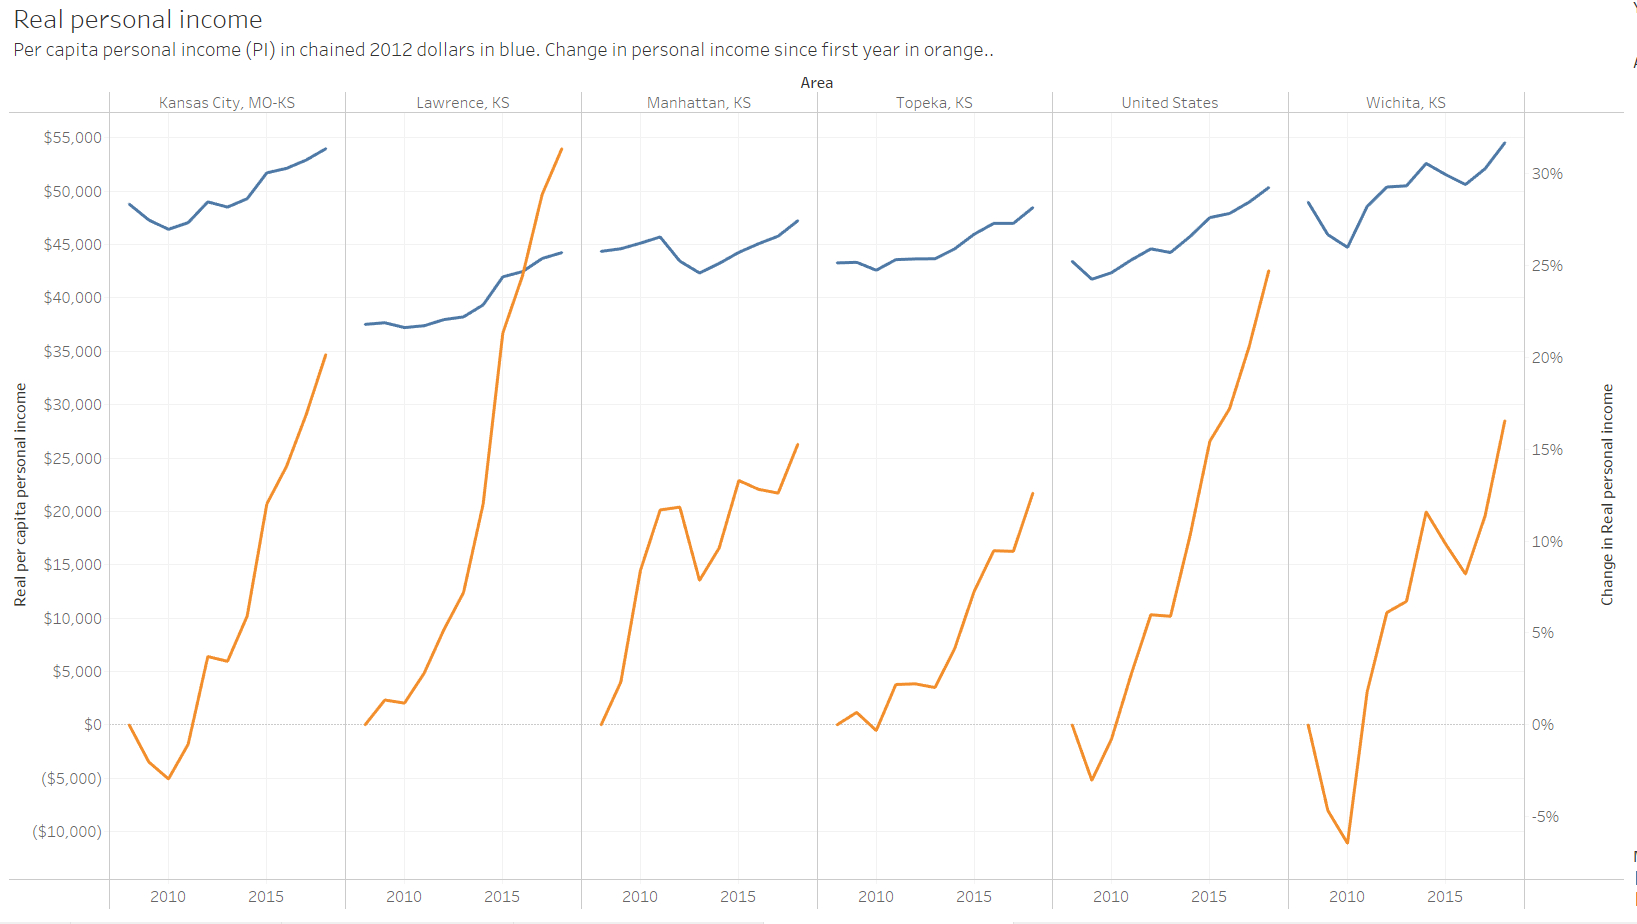
Real personal income in states and metros
When adjusted for regional differences, personal income in Wichita and Kansas is higher than otherwise, but growth is slow.
-
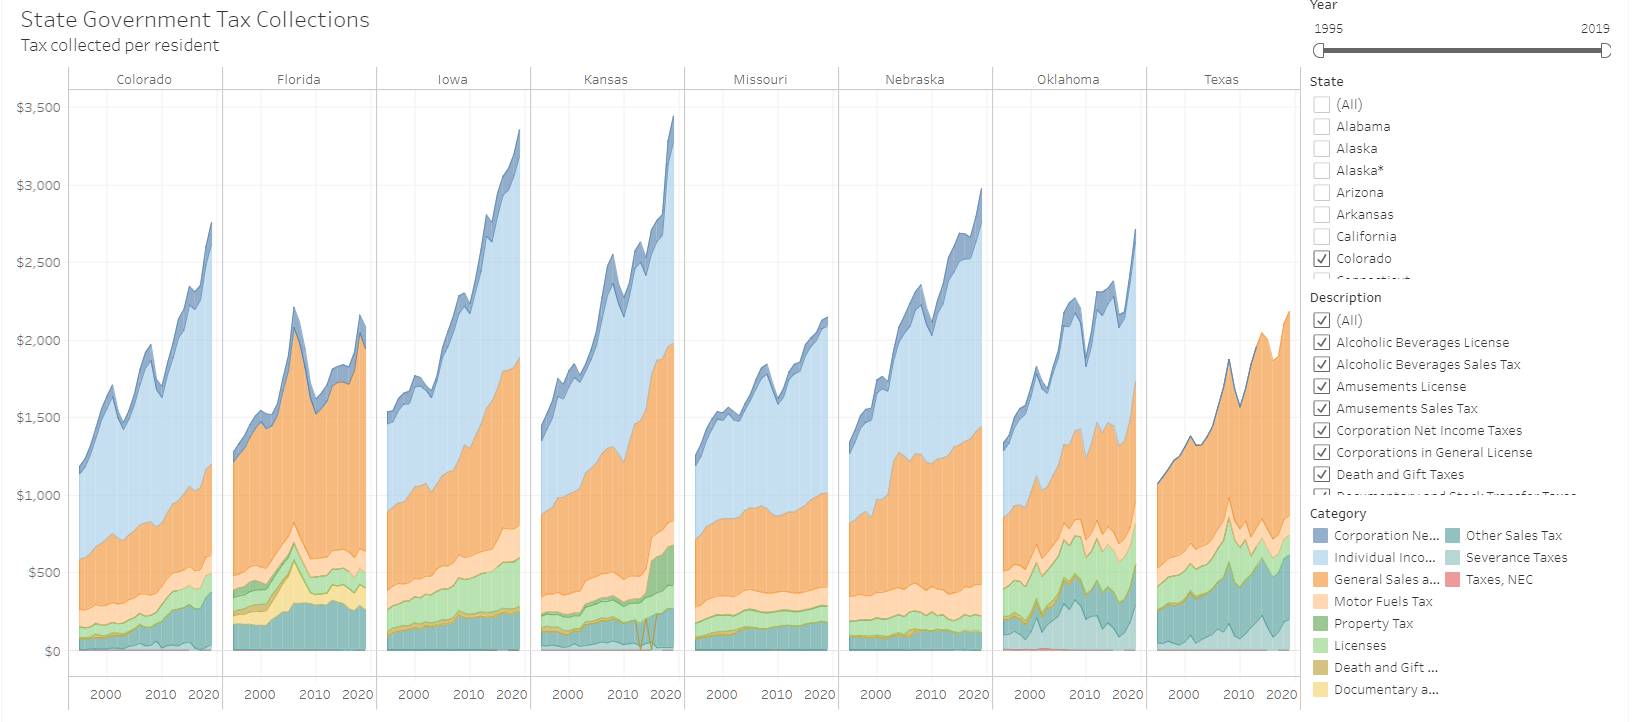
State government tax collections for 2019
Kansas state government tax collections rose to $3,443 per person in 2019, an increase of 5.0 percent from 2018.
-
Kansas tax revenue experiences effects of pandemic response
For April, Kansas retail sales tax collections fell by 8.2 percent from last April, and much income tax revenue is deferred to July.
-

Metropolitan employment and labor force
A visualization of employment, labor force, and unemployment rate for metropolitan areas, now with data through February 2020.
-

Small area income and poverty estimates
An interactive visualization of household income and poverty data for states and counties.
-

Kansas school employment
Kansas school employment rose for the current school year.
-

Kansas school salaries
Kansas school salaries, visualized.
-

Kansas tax receipts
Kansas tax receipts by category, presented in an interactive visualization. Now with data through December 2019.
-

Private investment declines
While government spending rises, private domestic investment declines.
-
Updated: Wichita, Kansas, and National Employment
A visualization of national, Kansas, and Wichita nonfarm employment series. Updated with data through December 2019.