Tag: Visualizations
-

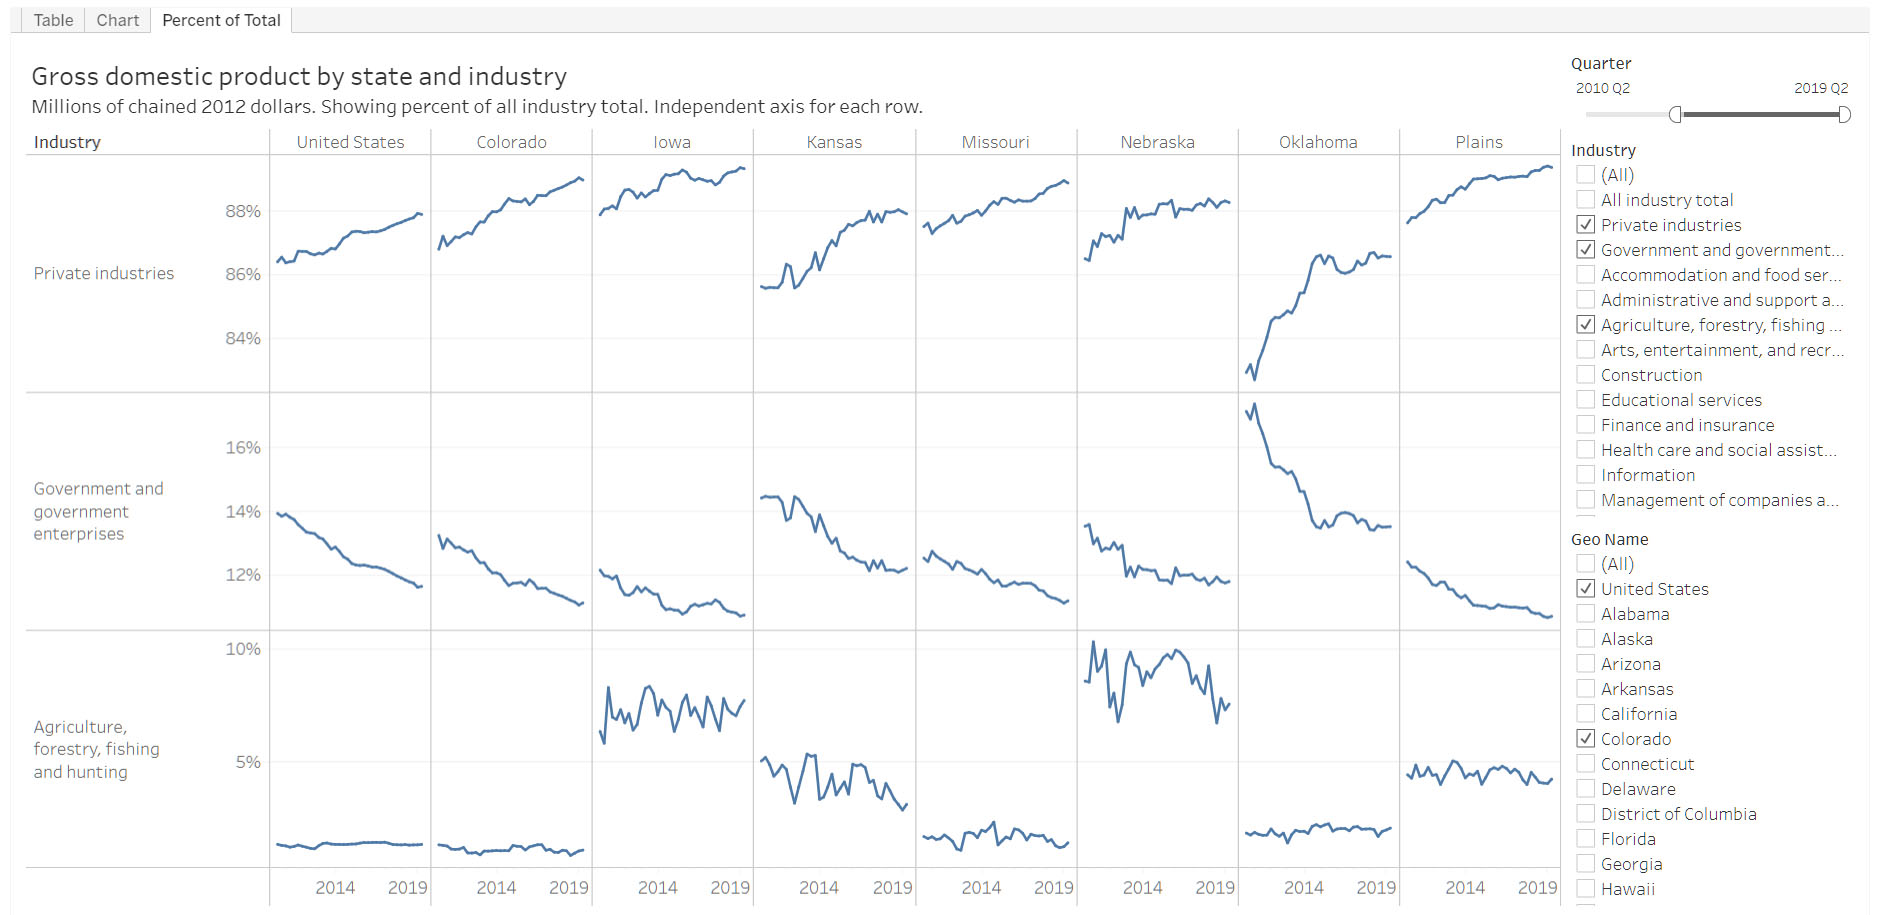
GDP by metropolitan area and component
An interactive visualization of gross domestic product by metropolitan area and industry.
-
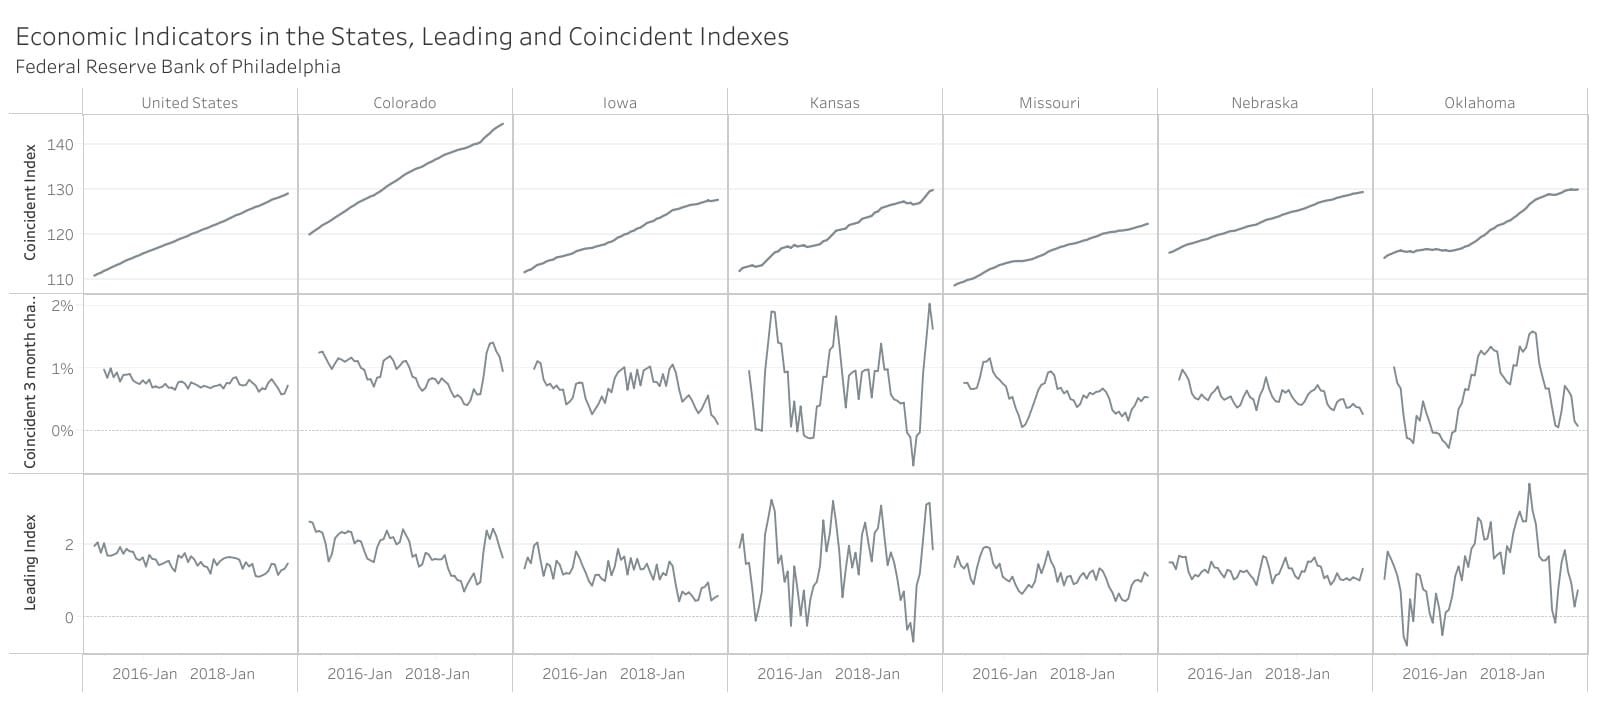
Updated: Economic indicators in the states
Economic indicators in the states, an interactive visualization.
-
Quarterly Real GDP in Kansas
Examining changes in GDP and industry contribution in Kansas.
-
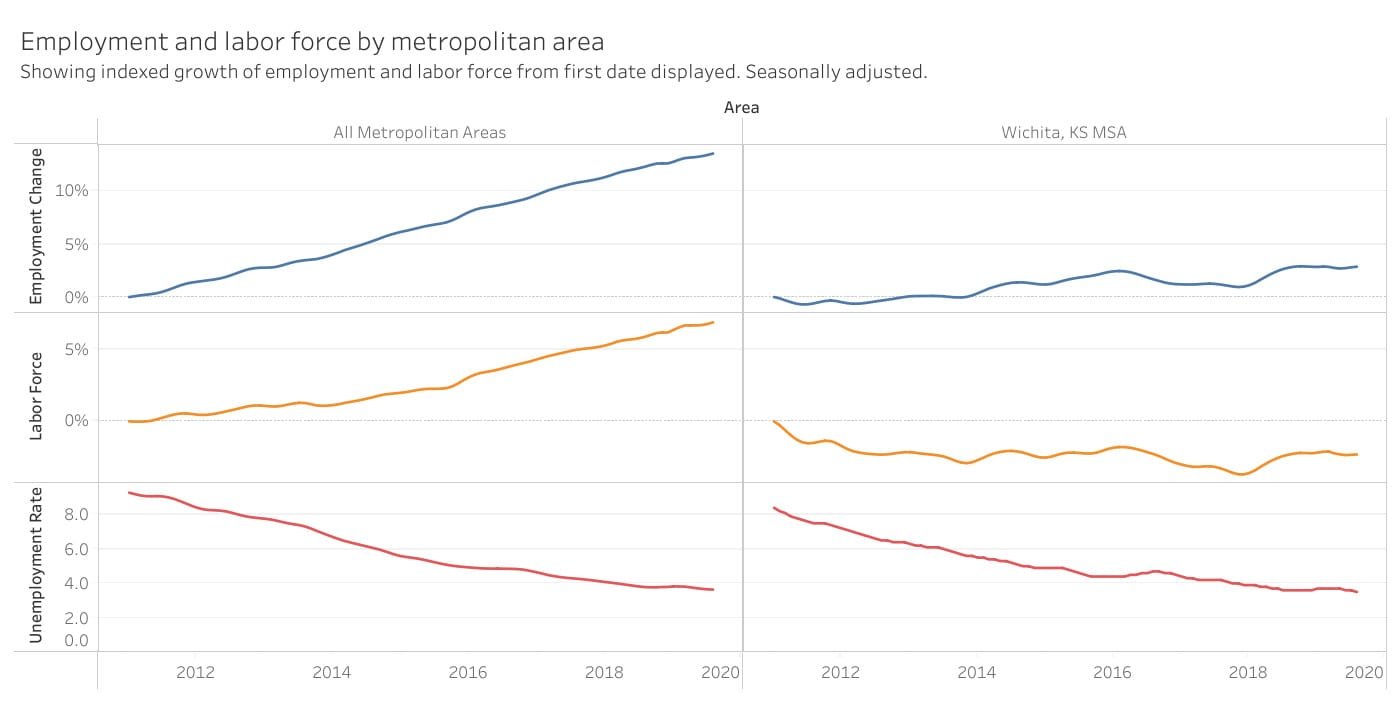
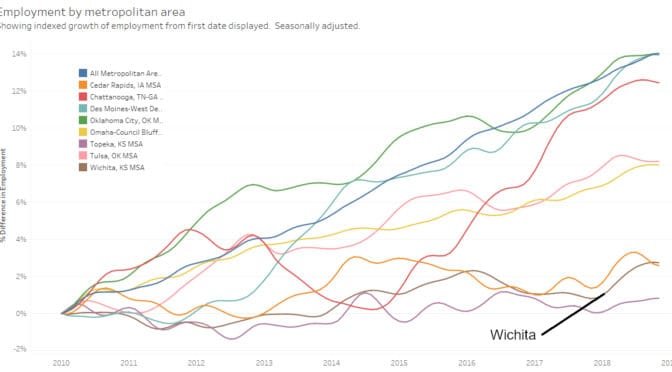
The cause of the low unemployment rate in Wichita
The unemployment rate for Wichita and the nation is nearly equal over the last eight years. Job growth for Wichita, however, has been much slower than the nation, and the labor force for Wichita is actually smaller than in January 2011. This is what has led to a low unemployment rate in Wichita: Slow job…
-

State and local government employees and payroll
Looking at the number of government employees in proportion to population, Kansas has many compared to other states, and especially so in education.
-

Wichita checkbook updated
Wichita spending data presented as a summary, and as a list.
-
Metropolitan employment and labor force
A visualization of employment, labor force, and unemployment rate for metropolitan areas, now with data through May 2019.
-
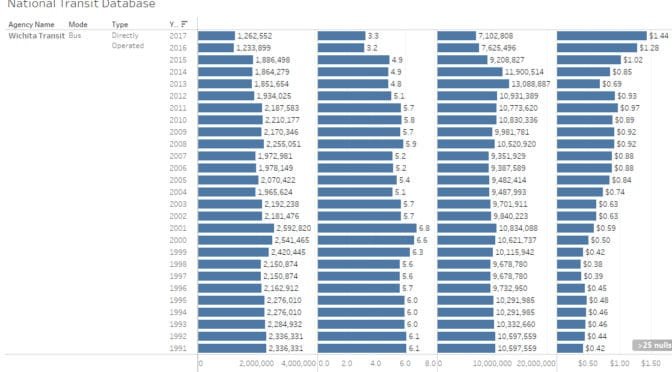
Updated: National transit database
An interactive visualization of data over time from the National Transit Database. Now with data through 2017.
-
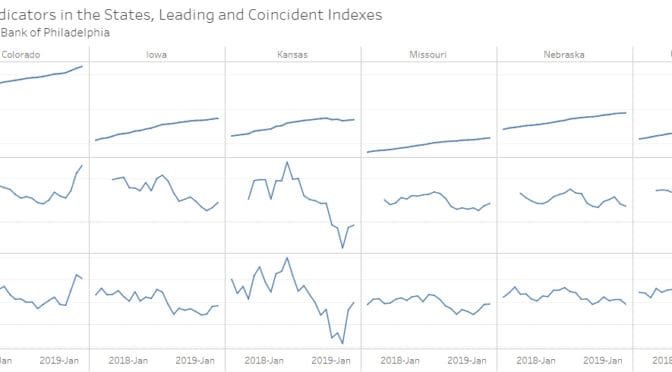
Updated: Economic indicators in the states
After a trend of decline, coincident and leading economic indicators for Kansas are improving.
-
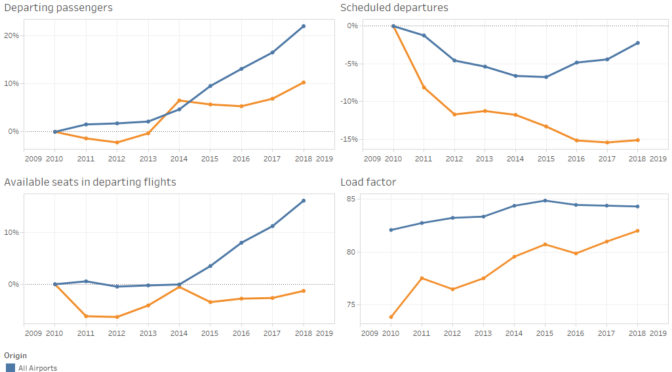
Airport traffic statistics, 2018
Airport traffic data presented in an interactive visualization, updated through 2018.
-
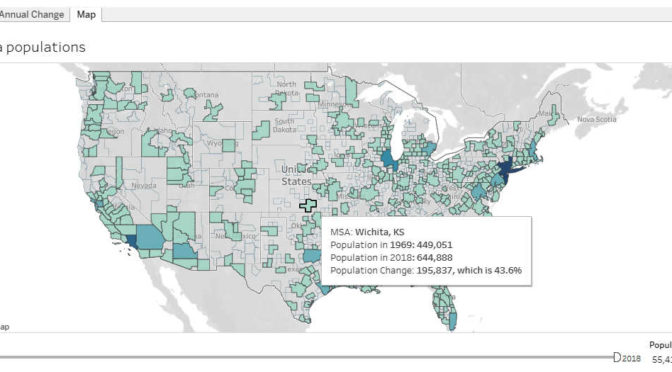
Updated: Metropolitan populations
A visualization of the population of metropolitan statistical areas, now with annual data from 1969 through 2018.
-

Updated: Populations of the states
An interactive table and charts of populations in the states and regions, from 1929 through 2018.