Tag: Visualizations
-
Updated: State government tax collections
Kansas personal income tax collections rose by $372 per person in 2018, an increase of 46.5 percent.
-

Updated: Gross domestic product by state and industry
An interactive visualization of GDP by state and industry, updated with annual data through 2018.
-

Updated: Employment in the States
An interactive visualization of the civilian labor force, employment, and unemployment, for each state. Updated through March 2019.
-

Updated: Kansas hotel guest tax collections
Kansas hotel guest tax collections presented in an interactive visualization. Updated through January 2019.
-
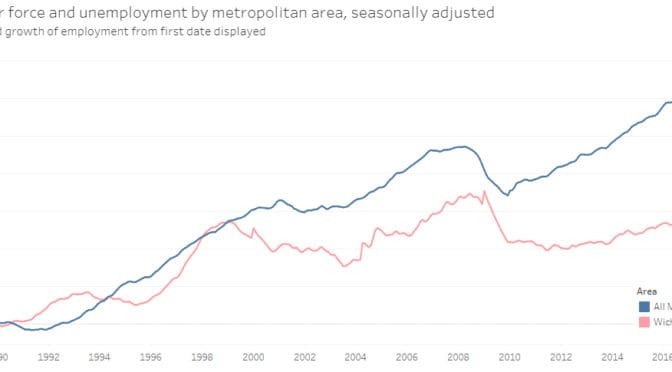
Updated: Metro area employment and unemployment
An interactive visualization of labor force, employment, and unemployment rate for all metropolitan areas in the United States. Updated through January 2019.
-
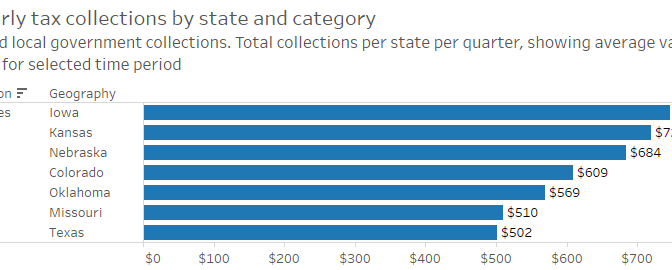
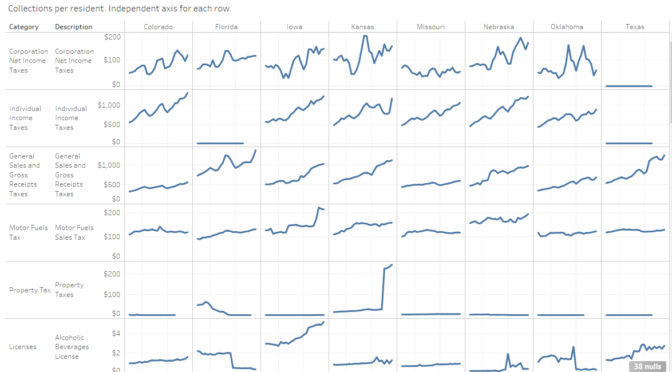
State tax collections updated
Now updated with data through the third quarter of 2018, quarterly state and local government tax collections.
-

Kansas agency expenditures
Data regarding State of Kansas agency spending presented in an interactive visualization.
-

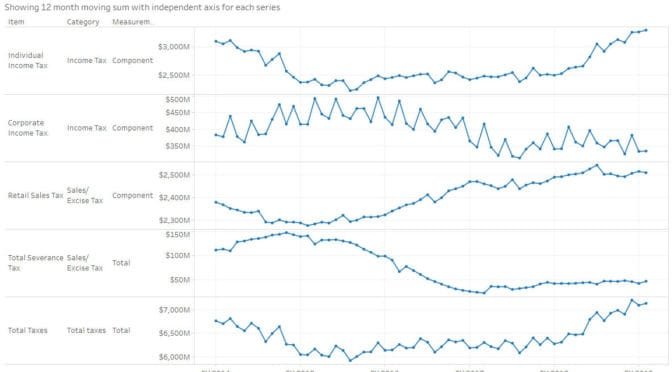
Updated: Kansas tax receipts
Kansas tax receipts by category, presented in an interactive visualization.
-
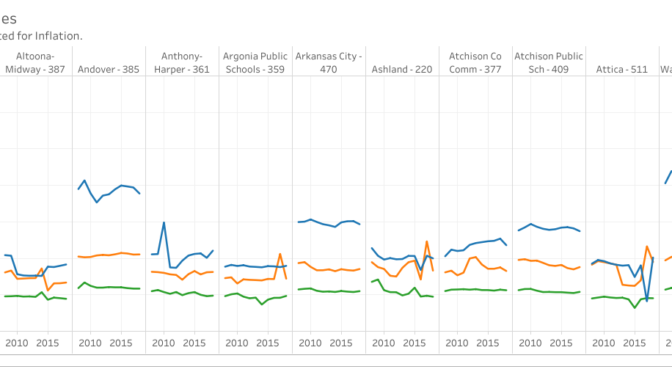
Kansas school salaries
An interactive visualization of Kansas school salaries by district and category.
-
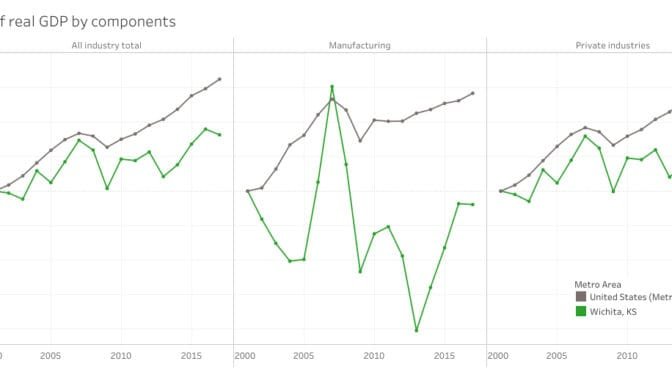
GDP by metropolitan area and component
An interactive visualization of gross domestic product by metropolitan area and industry.
-
Kansas tax receipts
Kansas tax receipts by category, presented in an interactive visualization.
-
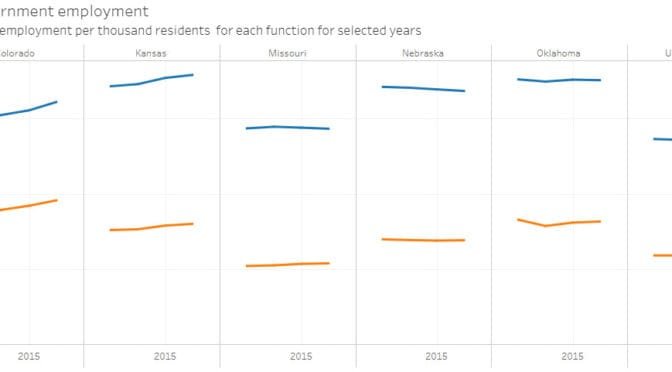
State government employees in Kansas
Kansas has more state government employees per resident than most states, and the trend is rising.