Following are visualizations of data. Many are interactive and created using Tableau Public. In some cases I’ve recorded myself using the visualization to tell a story, and all you have to do is watch.
An interactive visualization of revenue and spending data for Kansas school districts.
The accompanying visualization holds both nominal dollar amounts and amounts adjusted to reflect 2016 dollars. Data includes state aid, local aid, federal aid, and total spending for each school district, both total and per pupil. The visualization includes both tables and charts.
For the school year ending in 2016, total spending per pupil was $13,015. This is down from an inflation-adjusted $13,222 for 2015, a decline of 1.56 percent. Considering state funding only, per-pupil funding for 2016 was $8,540, down from an inflation-adjusted $8,631 for 2016, a decline of 1.05 percent.
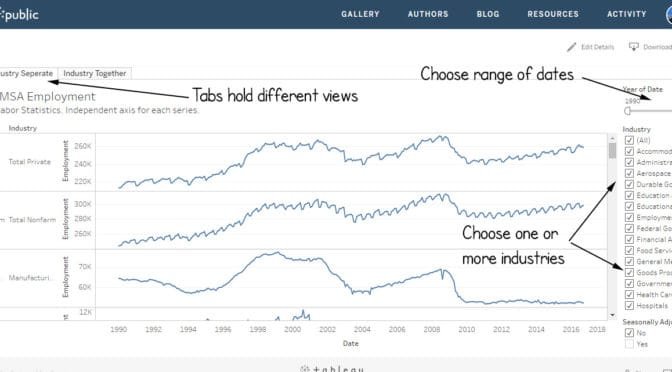
An interactive visualization of Wichita-area employment by industry.
The Bureau of Labor Statistics, part of the United States Department of Labor, makes monthly employment statistics available. I’ve gathered them for the Wichita metropolitan area and present them in an interactive visualization.
This data comes from the Current Employment Statistics, which is a monthly survey of employers.1
The three tabs along the top of the visualization represent three different views of the data; one table and two charts. Employment figures are in thousands. All series except one are not seasonally adjusted.
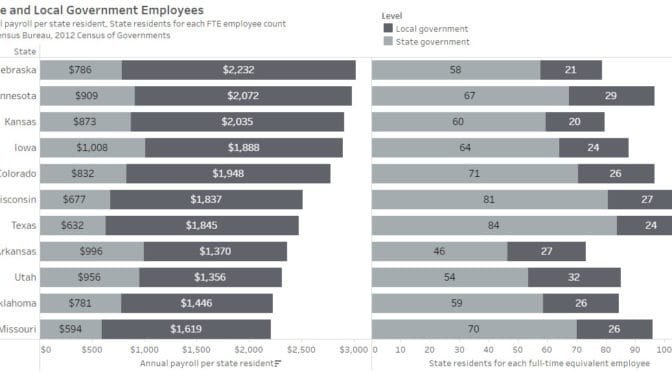
On Facebook, a person wrote “We were already a frugal state …” (I’ve obscured the name to protect the uninformed.)
Is this true? What is the state and local government spending in Kansas, on a per-person basis? How does it compare to other states?
Every five years the U.S. Census Bureau conducts a census of governments. In its own words: “The Census of Governments identifies the scope and nature of the nation’s state and local government sector; provides authoritative benchmark figures of public finance and public employment; classifies local government organizations, powers, and activities; and measures federal, state, and local fiscal relationships.”1
I’ve gathered data from the 2012 census of governments — which is the most recent — and made it available in an interactive visualization. Nearby is a snapshot from the visualization, showing Kansas and nearby states, and a few others. (Using the visualization, you may select your own set of states to compare.)
In the visualization, you can see that Kansas spends quite a bit more than nearby states. Of special interest is Minnesota, which is often used as an example of a high-tax state, and a state with excellent schools and services. But Minnesota spends barely more than Kansas, on a per-person basis.
What about Colorado? It seems that Kansans often look to Colorado as a state full of bounty. But Kansas outspends Colorado. Same for New Mexico, Wisconsin, Texas, and — especially — Missouri.
So: Is Kansas a frugal state? It doesn’t seem it is.
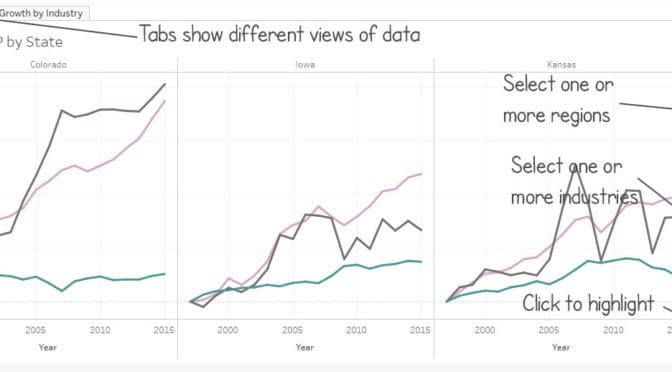
An interactive visualization of gross domestic product by state and industry.
The Bureau of Economic Analysis, a unit of the U.S. Department of Commerce, gathers data about economic output, known as gross domestic product. The visualization presented here presents this data in tabular and graphic form.
The GDP figures are real, meaning adjusted for inflation. They are annual numbers through 2015.
BEA industry classification, showing subtotal and total classificationsAs illustrated below, the visualization has three tabs, meaning three different views of data. By using the controls at the right of the visualization, you may select one or more states, and one or more industries. By clicking on entries in the legend, you may highlight one or more series. (Use Ctrl+click to select more than one.)
As indicated in the nearby table, some of the “industries” are actually subtotals of several industry components. The industry “All industry total” is the total GDP of all industries.
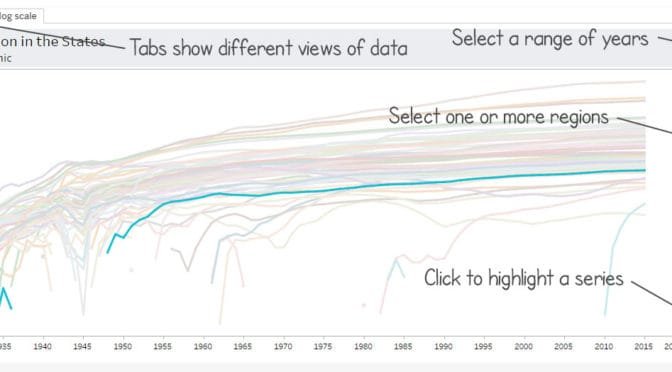
An interactive table and charts of populations in the states and regions, starting in 1929.
How have the states grown in population since 1929? Growth varies greatly.
In the accompanying visualization, one chart of the growth of population uses a logarithmic scale. This better shows a wide range of values. On this scale, negative values can’t be shown. The example shown in this article highlights Kansas against the other states.
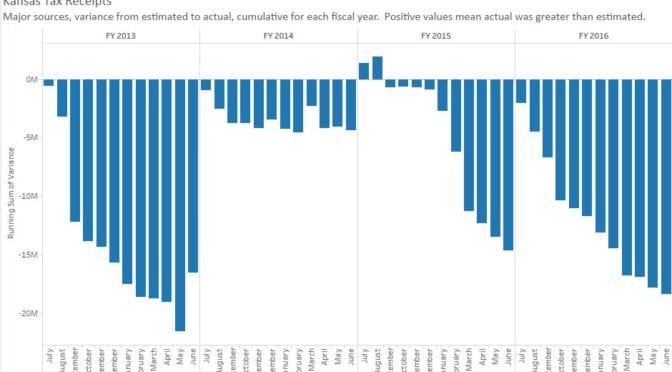
Kansas tax receipts by category, presented in an interactive visualization.
This visualization and article have been updated. Click here.
The Kansas Division of the Budget publishes monthly statistics regarding tax collections. These figures have been gathered and are presented in an interactive visualization. In the visualization, there are these available tabs:
Table.s: A table of data. For each month the two data items supplied by the state are the actual value and the estimated. This table also holds the computed variance, or difference, between the actual value and the estimated value. A positive number means the actual value was greater than the estimated value.
Collections: Shows monthly collections for each component. Because monthly numbers vary widely, this data is presented as the moving average of the previous 12 months.
Annual Change: Shows the change from the same month of the previous year. A positive value means the value for this month is greater than the same month last year.
Estimates: The Governor’s Consensus Revenue Estimating Working Group provides monthly estimates. This chart shows the variance, or difference, between the actual value and the estimated value. A positive number means the actual value was greater than the estimated value.
Running Total Estimates: This is the cumulative sum of the estimate variances, reset to zero at the start of each fiscal year (July 1).
Running Total Change from Prior Year: This is the cumulative sum of the monthly changes from the prior year, reset to zero at the start of each fiscal year (July 1).
For the past two years, individual income tax collections have been relatively flat. There are variations each month, but overall the trend is slightly up. Corporate income tax collections are on a slight downward trajectory.
Retail sales tax and compensating use tax have been mostly rising for two years. A higher sales tax rate took effect on July 1, 2015, with the rate rising from 6.15 percent to 6.50 percent.
Cigarette taxes have risen rapidly since July 2015 when higher tax rates on these products took effect. The same trend is present in the tobacco products tax.
Severance taxes — tax collected on natural gas and oil as it is extracted from the ground — have been on a downward trend as prices for these products have fallen. This is a sizable tax. In June 2014 collections of this tax were running at about $143 million per year. For September 2016, the rate is $22 million annually.
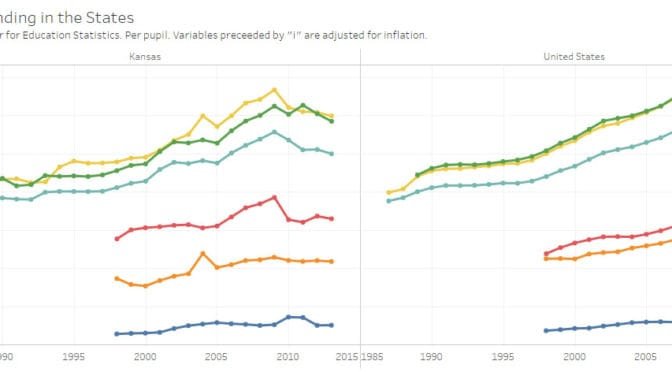
School spending in the states, presented in an interactive visualization.
The Elementary/Secondary Information System (ElSi) is a project of National Center for Education Statistics (NCES). NCES is “the primary federal entity for collecting and analyzing data related to education in the U.S. and other nations. NCES is located within the U.S. Department of Education and the Institute of Education Sciences.”1 Here is data from ElSi regarding per-pupil revenue and spending in the states.
Near the end of this article are definitions of each measure. There are measures for total expenditures and total current expenditures. The major difference is that the current expenditures measure does not include the cost of construction of schools and the expense of debt associated with that.
Of note, the values for “United States” are the average of the values for the states, computed with equal weight without regard for the total spending or number of students in each state.
As of the date of publication, data was available through the school year ending in 2013.
Since these data series cover substantial periods of time, I’ve also used the Consumer Price Index2 to adjust the figures for the effects of inflation. Each measure has a companion whose name starts with “i.” This is the value adjusted for inflation, based on the CPI. You may choose to view the values as reported by ElSi, which are in current dollars. These are the values not adjusted for inflation. Or, you may use the “i.” measures, which are in constant dollars.3
This data is presented in an interactive visualization created using Tableau Public. To access the visualization and its explanatory page, click here.
School spending in Kansas and the United States. Click for larger.
Definitions of measures
Total Revenues (TR) per Pupil (MEMBR) [State Finance]
Total revenues per student ate the total revenues from all sources (tr) divided by the fall membership as reported in the state finance file.
Total Expenditures (TE11+E4D+E7A1) per Pupil (MEMBR) [State Finance]
This is the Total Expenditures (Digest) divided by the fall membership as reported in the state finance file. The Total Expenditures (Digest) is the subtotal of Direct State Support Expenditures for Private Schools (e4d).
Total Current Expenditures for Public El-Sec (TE5) per Pupil (MEMBR) [State Finance]
This is the total current expenditures for public elementary and secondary education (te5) divided by the fall membership as reported in the state finance file. The Expenditures for equipment, non-public education, school construction, debt financing and community services are excluded from this data item.
Local Revenues (STR1+R2) per Pupil (MEMBR) [State Finance]
Local revenues per student are the total of all local revenue categories (strl and r2) divided by the fall membership as reported in the state finance file. Local revenues are raised and allocated by local governments.
State Revenues (R3) per Pupil (MEMBR) [State Finance]
State revenues per student are revenues received by the LEAs from the state (r3). divided by the fall membership as reported in the state finance file.
Federal Revenues (STR4) per Pupil (MEMBR) [State Finance]
Federal revenues per student are federal revenues (str4) divided by the fall membership as reported in the state finance file.
United States Bureau of Labor Statistics. Consumer Price Index.www.bls.gov/cpi/. ↩
The U.S. Census Bureau explains: ” Constant-dollar values represent an effort to remove the effects of price changes from statistical series reported in dollar terms. The result is a series as it would presumably exist if prices were the same throughout as they were in the base year-in other words, as if the dollar had constant purchasing power.” Current versus Constant (or Real) Dollars.www.census.gov/topics/income-poverty/income/guidance/current-vs-constant-dollars.html. ↩
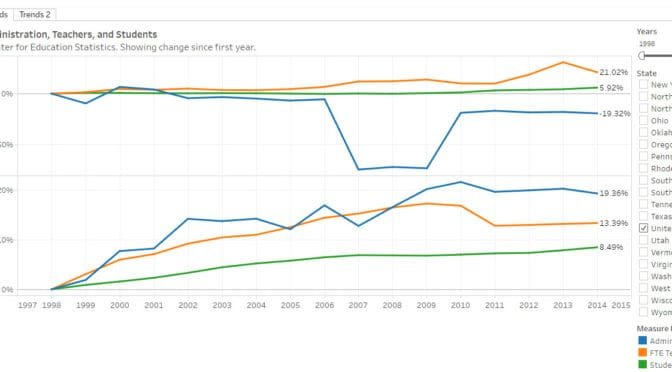
Trends for the nation and each state in teachers, administrators, and students, presented in an interactive visualization.
Each year states report data to the National Center for Education Statistics. While NCES provides methods for extracting data, it isn’t an easy process, and opportunities to produce charts are limited. Here I present trends in teachers, administrators, and students for each state from 1998 to the school year ending in summer 2014, the most recent year of data that is available.
For each state, the charts show the growth in teachers, administrators, and students. For both teachers and students, the value used is full-time equivalency. A table also shows pupil/teacher ratio and pupil/administrator ratio.
There are some obvious mistakes in the data. An example is the number of administrators reported for Kansas for years 2007 through 2009. Figures obtained directly from Kansas State Department of Education show no sudden drop and increase in the count of administrators. Nonetheless, I have presented the data as retrieved from NCES.
Sorting on columns.For the nation as a whole, the count of students has increased 8.5 percent since 1998. The count of teachers (full-time equivalent) rose by 13.4 percent, and the number of administrators by 19.4 percent. Individual states vary widely, with many having increased administrators at a far faster pace than either students or teachers. Some states, however, have reduced the number of administrators, or the rate has grown slower than students and teachers.
Data is from the Elementary/Secondary Information System (ElSi) at National Center for Education Statistics, part of the U.S. Department of Education and the Institute of Education Sciences. The number of administrators is calculated as the sum of “LEA Administrators” and “LEA Administrative Support Staff.” LEA Administrators is defined by NCES as “The count of Local education agency superintendents, deputy and assistant superintendents, and other persons with district-wide responsibilities such as business managers and administrative assistants. Excludes supervisors of instructional or student support staff.” LEA Administrative Support Staff is defined as “The count of Staff members who provide direct support to LEA administrators, including secretarial and other clerical staff.”


 On Facebook, a person wrote “We were already a frugal state …” (I’ve obscured the name to protect the uninformed.)