Tag: Visualizations
-

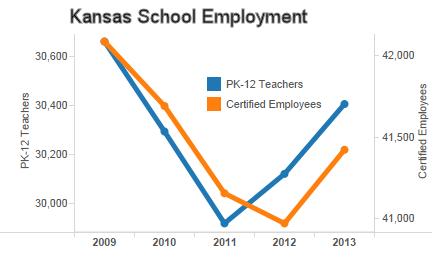
Kansas school employment: Mainstream media notices
When two liberal newspapers in Kansas notice and report the lies told by a Democratic candidate for governor, we know there’s a problem.
-
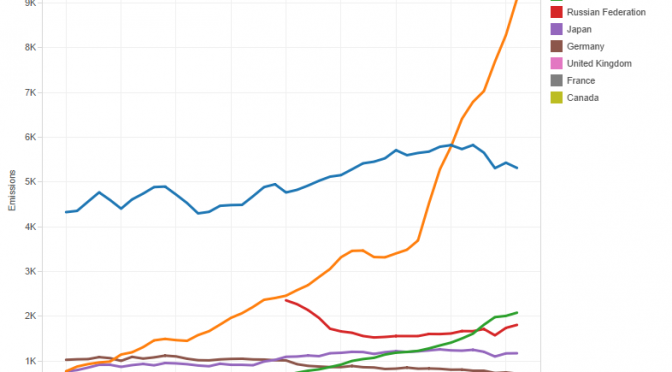
Primary U.S. energy production by fuel source
Primary U.S. energy production by fuel source, an interactive visualization.
-
American economy is more competitive and carbon-efficient, says economist
The oil and gas boom in America boosts our competitiveness in the world economy while at the same time reducing carbon emissions, says economist Stephen Moore.
-
Kansas school employment: The statistics and the claims
Claims made about Kansas schools don’t match the state’s statistics
-

Kansas school test scores must be evaluated considering demographics
When comparing Kansas school test scores to those of other states, it’s important to consider disaggregated data. Otherwise, we may form an inaccurate and unfounded impression of Kansas schools.
-
Kansas school test scores, the subgroups
To understand Kansas school test scores, look at subgroups.
-
Kansas gross domestic product
Kansas is right about in the middle of the states for growth in gross domestic product.
-
Wichita’s growth in gross domestic product
Compared to peer areas, Wichita’s record of growth in gross domestic product is similar to that of job creation: Wichita performs poorly.
-
Kansas schoolchildren shortchanged by Kansas City Star
Another newspaper editorialist ignores the facts about Kansas schools. This is starting to be routine.
-
For Wichita’s economic development machinery, failure
Compared to a broad group of peer metropolitan areas, Wichita performs very poorly. As Wichita embarks upon a new era of economic development, we need to ask who to trust with this important task.
-
Job growth, Kansas and other states
Critics of Kansas Governor Sam Brownback may not know that Kansas has produced substandard performance in job growth for a long time.
-
Employment visualization updated; Wichita still in last place
Wichita continues to lag behind its peer cities in job growth, according to data from the Bureau of Labor Statistics.