Tag: Visualizations
-

Kansas Tax Revenue, March 2023
For March 2023, Kansas tax revenue was 11.3 percent higher than March 2022. Collections for fiscal year 2023 after nine months are 9.5 percent greater than the prior year, and 9.5 percent above estimates.
-
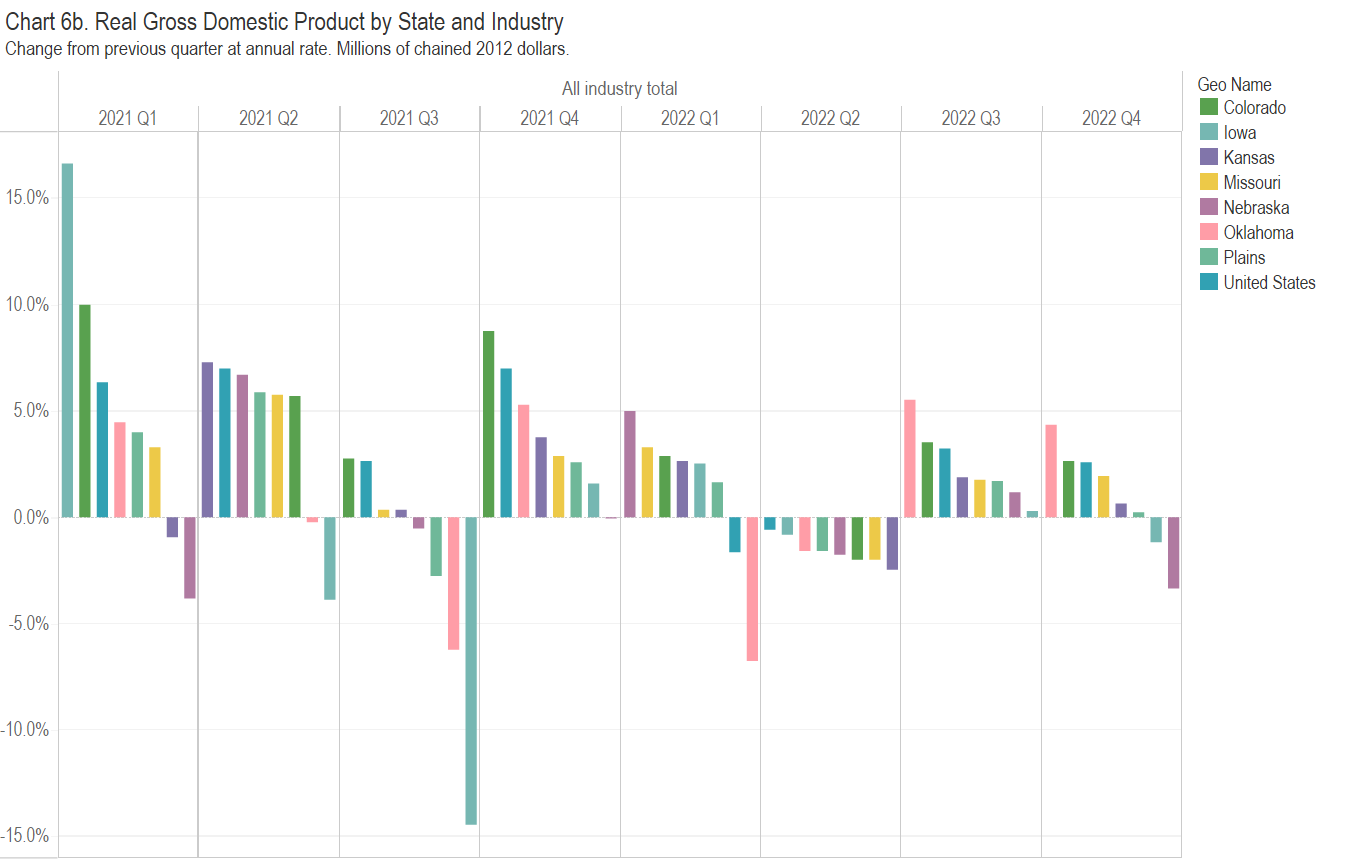
Kansas GDP, Fourth Quarter of 2022
In the fourth quarter of 2022, the Kansas economy grew at the annual rate of 0.7 percent. Gross Domestic Product rose in 46 states, with Kansas ranking forty-first.
-

Kansas Tax Revenue, February 2023
For February 2023, Kansas tax revenue was 9.4 percent higher than February 2022. Collections for fiscal year 2023 after eight months are 9.2 percent greater than the prior year.
-
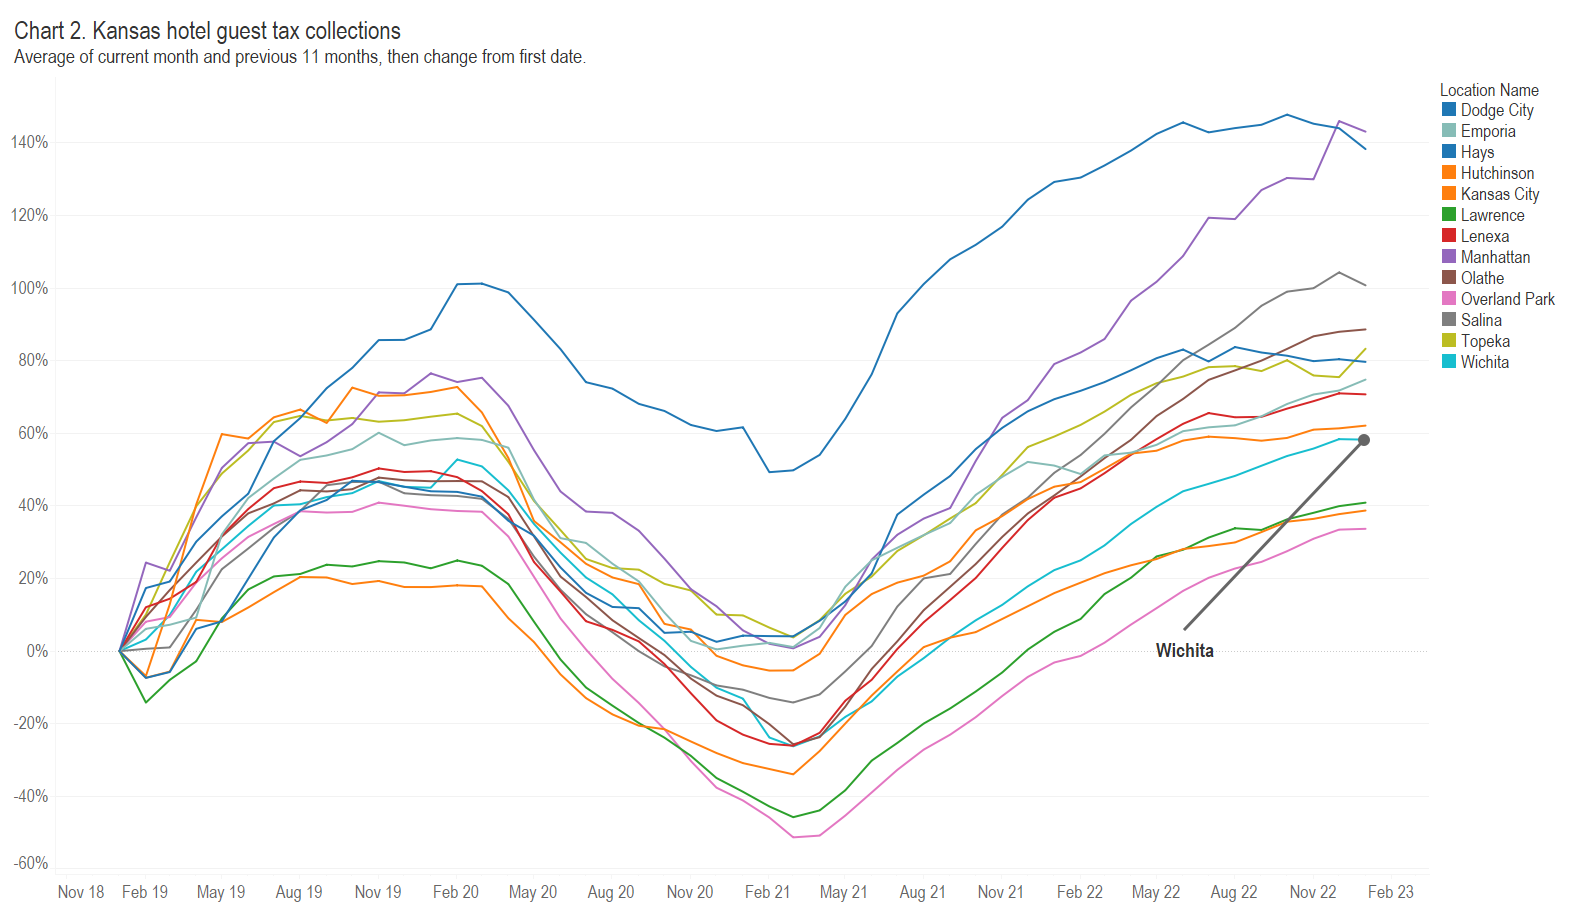
Updated: Kansas hotel guest tax collections
Kansas hotel guest tax collections presented in an interactive visualization. Updated with data through January 2023.
-
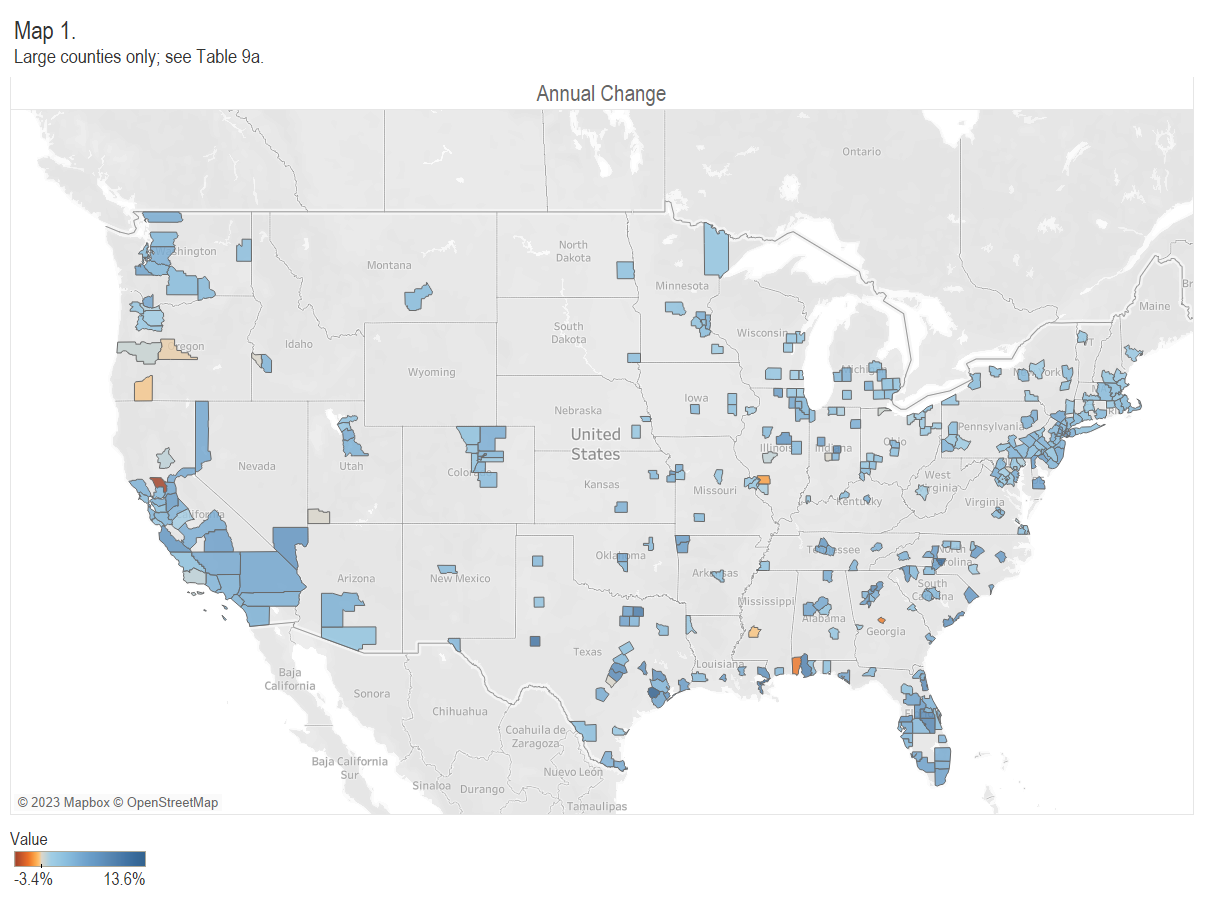
County Employment
Employment in large counties, including Sedgwick County and others of interest.
-
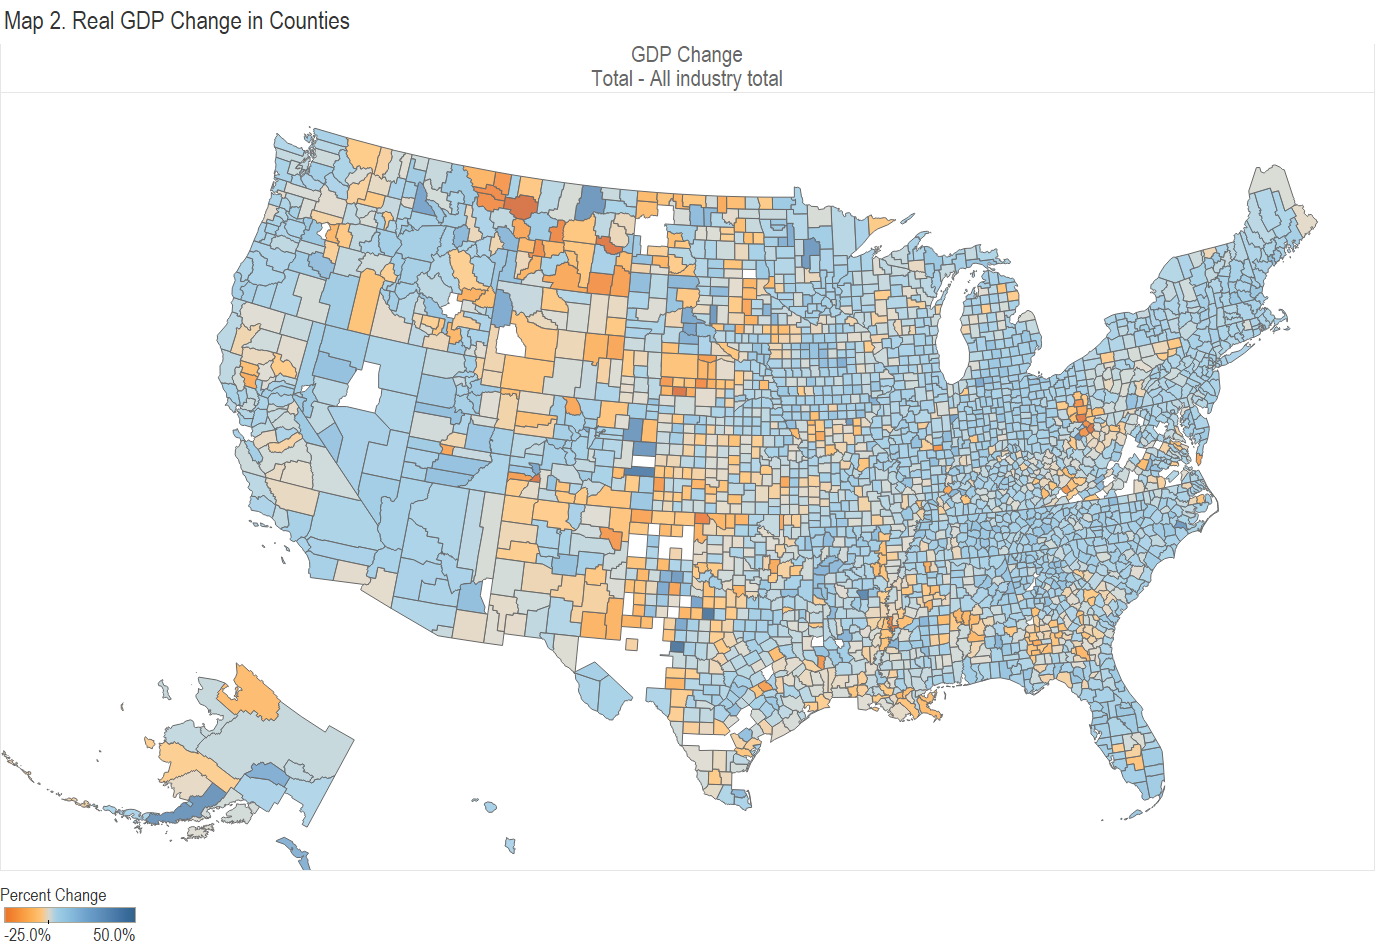
Gross Domestic Product by County and Industry
A visualization of real gross domestic product in counties by industry. Examples from Kansas included.
-

Business Formation in Kansas
For both business applications and business formations, Kansas does better than some states, but lags many states and the nation.
-

Kansas Tax Revenue, January 2023
For January 2023, Kansas tax revenue was 10.8 percent higher than January 2022. Collections for fiscal year 2023 after seven months are 9.2 percent greater than the prior year.
-

Presidential Data Explorer Updated
Explore the economic record of presidents, starting with Harry S Truman. Updated with recent data.
-

Kansas Tax Revenue, December 2022
For December 2022, Kansas tax revenue was 21.9 percent higher than December 2021. Collections for fiscal year 2023 after six months are 8.8 percent greater than the prior year.
-

Personal Income in Kansas and States, Third Quarter 2022
For the third quarter of 2022, Kansas personal income grew at the annual rate of 4.1 percent, ranking thirty-ninth among the states.
-

Presidential Data Explorer Updated
Explore the economic record of presidents, starting with Harry S Truman. Updated with recent data.