Tag: Wichita city government
-

On Wichita’s STAR bond promise, we’ve heard it before
Are the City of Wichita’s projections regarding subsidized development as an economic driver believable?
-
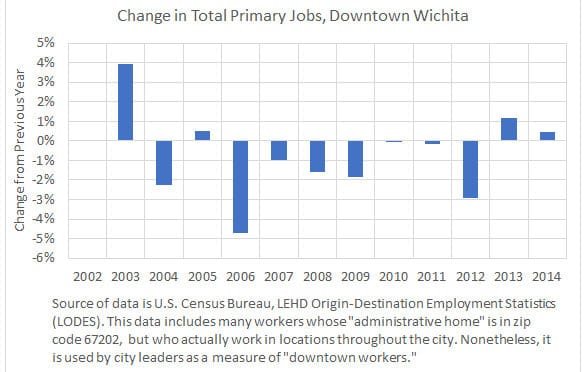
Growth in Downtown Wichita Jobs
Even if we accept the measure of jobs used by the City of Wichita, the trend is in the wrong direction. Citizens should ask for truth and accountability.
-
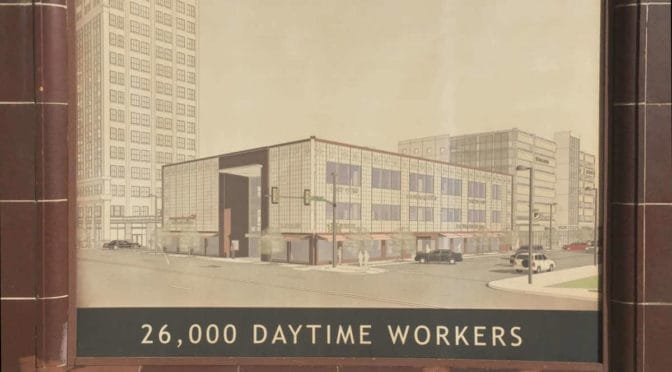
Downtown Wichita jobs, sort of
The claim of 26,000 workers in downtown Wichita is based on misuse of data so blatant it can be described only as malpractice.
-

Downtown Wichita’s Block One, a beneficiary of tax increment financing
Before forming new tax increment financing districts, Wichita taxpayers ought to ask for progress on current districts.
-
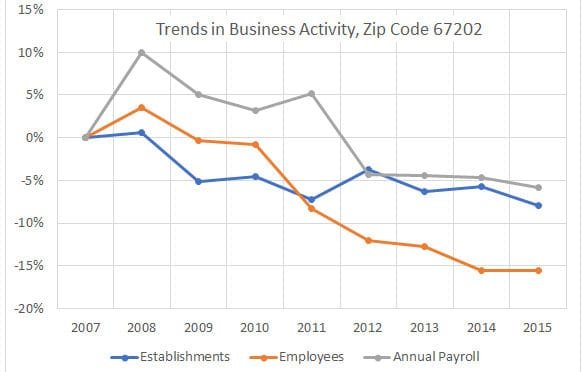
Downtown Wichita business trends
There has been much investment in Downtown Wichita, both public and private. What has been the trend in business activity during this time?
-

Cargill subsides start forming
Details of the subsidy programs used to keep Cargill in Wichita are starting to take shape.
-

Cash incentives in Wichita, again
The City of Wichita says it does not want to use cash incentives for economic development. But a proposal contains just that.
-
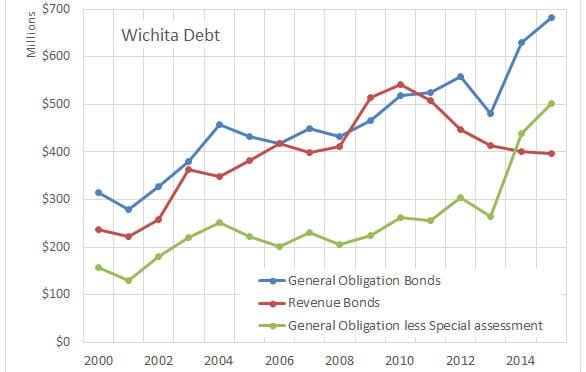
Wichita debt levels
Charts of Wichita debt. Source of data is Wichita Comprehensive Annual Financial Reports for years 2000 through 2015.
-

During Sunshine Week, here are a few things Wichita could do
The City of Wichita says it values open and transparent government, but the city lags far behind in providing information and records to citizens.
-
In Kansas, the war on property rights
John Todd makes an appearance on The Voice of Reason with Andy Hooser to talk about proposed legislation in Kansas that would be harmful to private property rights.
-

Wichita business property taxes still high
An ongoing study reveals that generally, property taxes on commercial and industrial property in Wichita are high. In particular, taxes on commercial property in Wichita are among the highest in the nation.
-

Wichita property tax rate: Level
The City of Wichita says it hasn’t raised its property tax mill levy in many years. For this year, the city is correct.