Category: Taxation
-

Kansas cities force tax breaks on others
When Kansas cities grant economic development incentives, they may also unilaterally take action that affects overlapping jurisdictions such as counties, school districts, and the state itself. The legislature should end this.
-
Sedgwick County delinquent property tax
An interactive version of the list of delinquent property taxes in Sedgwick County.
-
State taxes and charitable giving
States with higher rates of economic growth grow total charitable giving at a faster rate than states with low rates of economic growth, finds a new report by American Legislative Exchange Council.
-

Wichita property taxes still high, but comparatively better
An ongoing study reveals that generally, property taxes on commercial and industrial property in Wichita are high. In particular, taxes on commercial property in Wichita are among the highest in the nation, although Wichita has improved comparatively.
-

Kansas sales tax has disproportionate harmful effects
Kansas legislative and executive leaders must realize that a shift to consumption taxes must be accompanied by relief from its disproportionate harm to low-income households.
-

Tax rates and taxes paid
Those who call for a return to 90 percent tax rates should be aware that few people actually paid tax at those rates.
-

Taxation in the states
Examining tax collections by the states shows that Kansas collects more tax than many of our neighbors, and should put to rest some common myths.
-
The purpose of high tax rates
The purpose of high taxes on the rich is not to get the rich to pay money, it’s to get the middle class to feel better about paying high taxes.
-

Sin-tax or vice-tax?
As Kansas considers raising additional revenue by raising the tax on tobacco and alcohol, let’s declare the end to governmental labeling of vice as sin, and people as sinners.
-

Effect of federal grants on future local taxes
Do federal grants cause state and/or local tax increases in the future after the government grant ends?
-
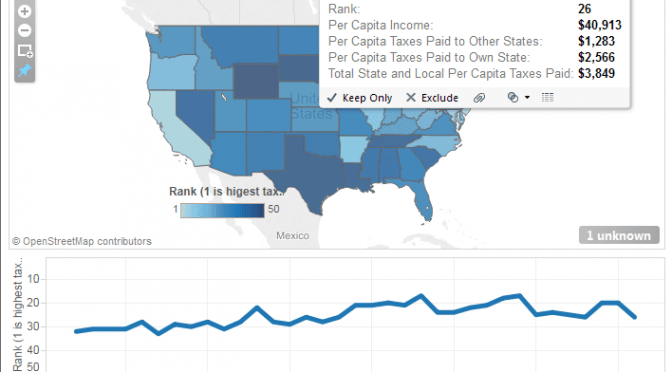
State and local tax burdens presented
An interactive visualization lets you see the tax burden for residents in any state, and see how the state’s rank has changed over time.
-
Putting a face on America’s tax returns
The Tax Foundation has a new version of their booklet Putting a Face on America’s Tax Returns.