Category: Taxation
-
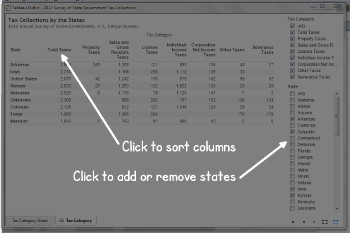
Tax collections by the states
Kansas state government collects more tax revenue than most surrounding states. Additionally, severance taxes are a minor contribution to collections, even in Texas.
-
Wichita property taxes compared
An ongoing study reveals that generally, property taxes on commercial and industrial property in Wichita are high. In particular, taxes on commercial property in Wichita are among the highest in the nation.
-
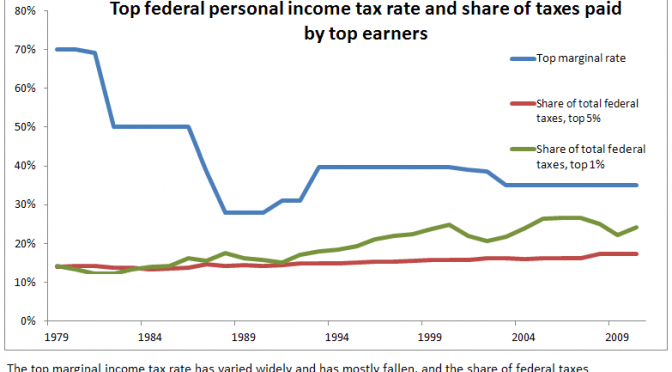
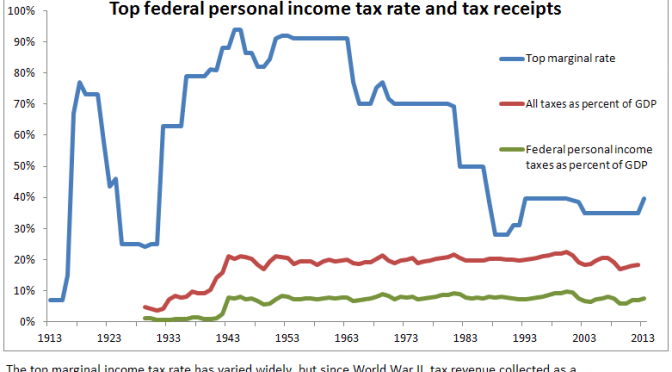
The relevance of income tax rates
Data shows that high tax rates on top earners doesn’t mean that they actually pay taxes at correspondingly higher rates.
-
The purpose of high tax rates on the rich
The purpose of high taxes on the rich is not to get the rich to pay money, it’s to get the middle class to feel better about paying high taxes.
-
Federal grants seen to increase future local spending
Not only are we taxed to pay for the cost of funding federal and state grants, the units of government that receive grants are very likely to raise their own levels of taxation in response to the receipt of the grants. This creates a cycle of ever-expanding government.
-
Part of Kansas tax law has something for everyone
The just-signed Kansas tax bill contains a future provision that, based on recent research, may satisfy everyone.
-
Derby forms a TIF district
The city of Derby, Kansas has formed a tax increment financing (TIF) district. TIF is a method of diverting the normal flow of property tax revenue so that it benefits private interests rather than the public treasury.
-
Tax burden in the states
As Kansas debates tax reform, and as our state is frequently compared to Texas, we should take a look at the two states and their taxes.
-
State and local tax burden visualized
For two decades the Tax Foundation has estimated the combined state and local tax burden for all the states. I’ve created an interactive visualization that lets you compare states and see trends in rank over time.
-
Eliminate mortgage interest deduction
The home mortgage interest deduction doesn’t accomplish much, and it should be eliminated.
-
Tax increment financing district (TIF) resources
Resources on tax increment financing districts, or TIF.