Category: Taxation
-
Supreme Court Hears Historic Arguments on Trump Tariffs: Can Presidents Tax Without Congress?
Can a president tax Americans without Congress? The Supreme Court just heard explosive arguments on Trump’s tariffs – with justices asking if a future president could declare a climate emergency to impose massive taxes. One justice called it a “one-way ratchet” where Congress would never get its constitutional power back. The stakes: trillions in trade…
-
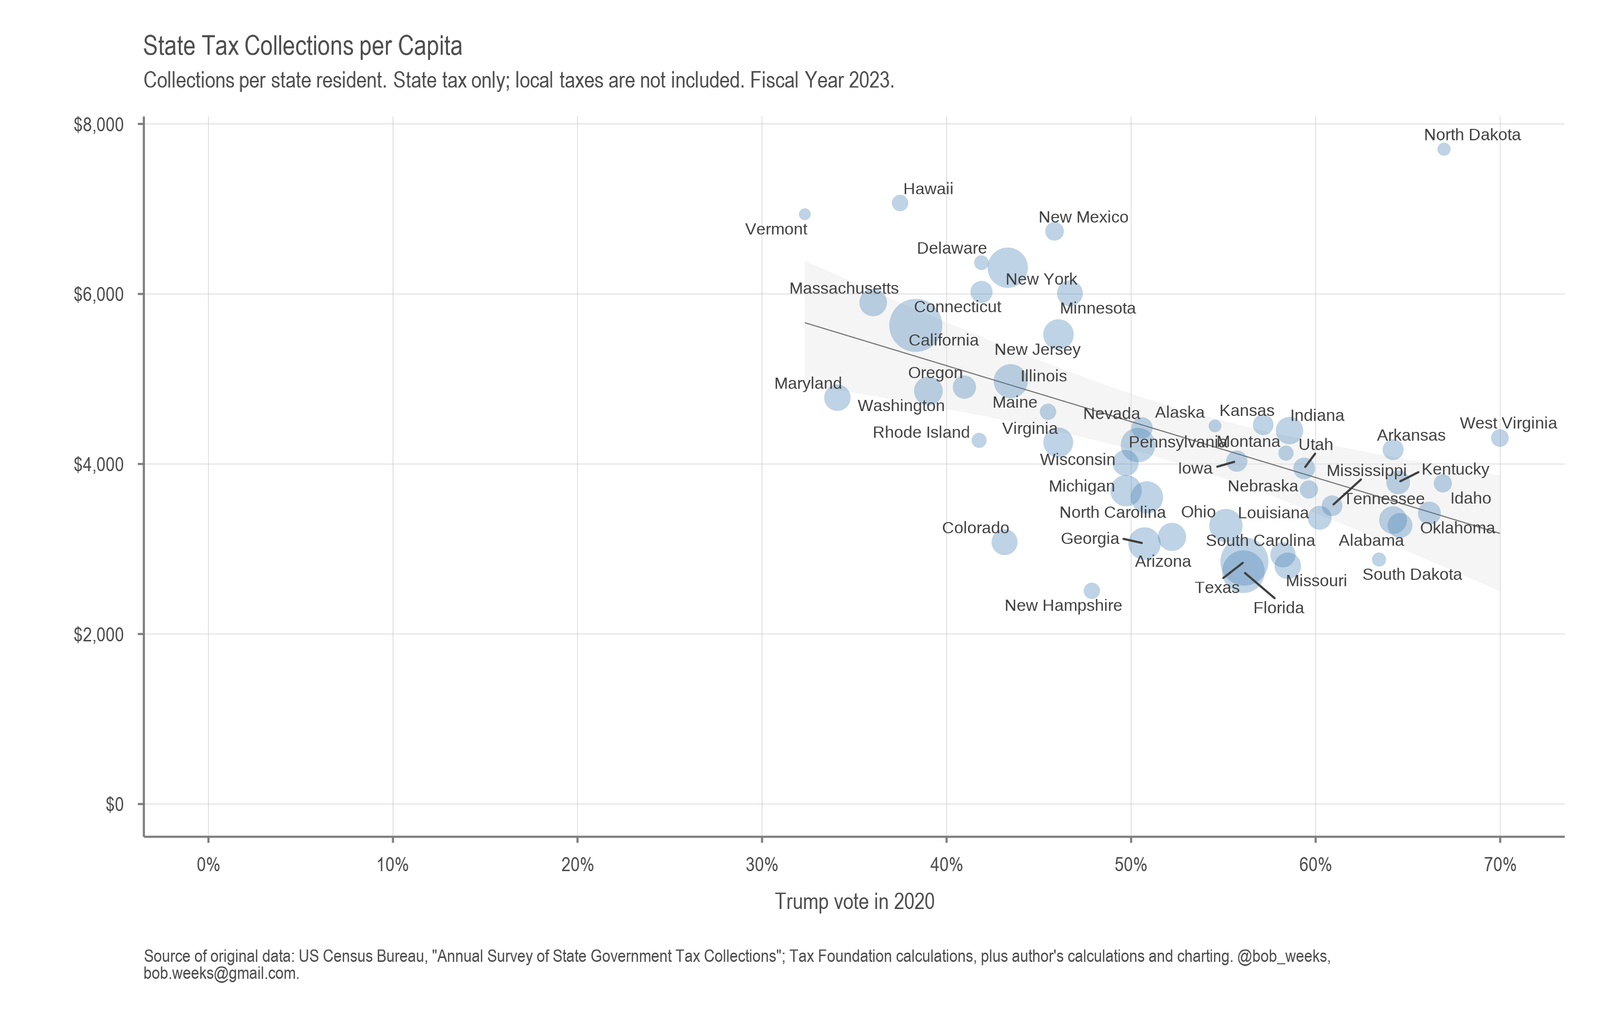
State Tax Collections
Using data from Tax Foundation, I examined state political sentiment and state tax collections.
-

Total State Taxes
Dollars per resident, adjusted for inflation. State taxes only.
-

Kansas State Government Tax Collections for 2021
Kansas state government tax collections rose to $3,958 per person in 2021, an increase of 14.9 percent from 2020, and of 9.2 percent from 2019.
-
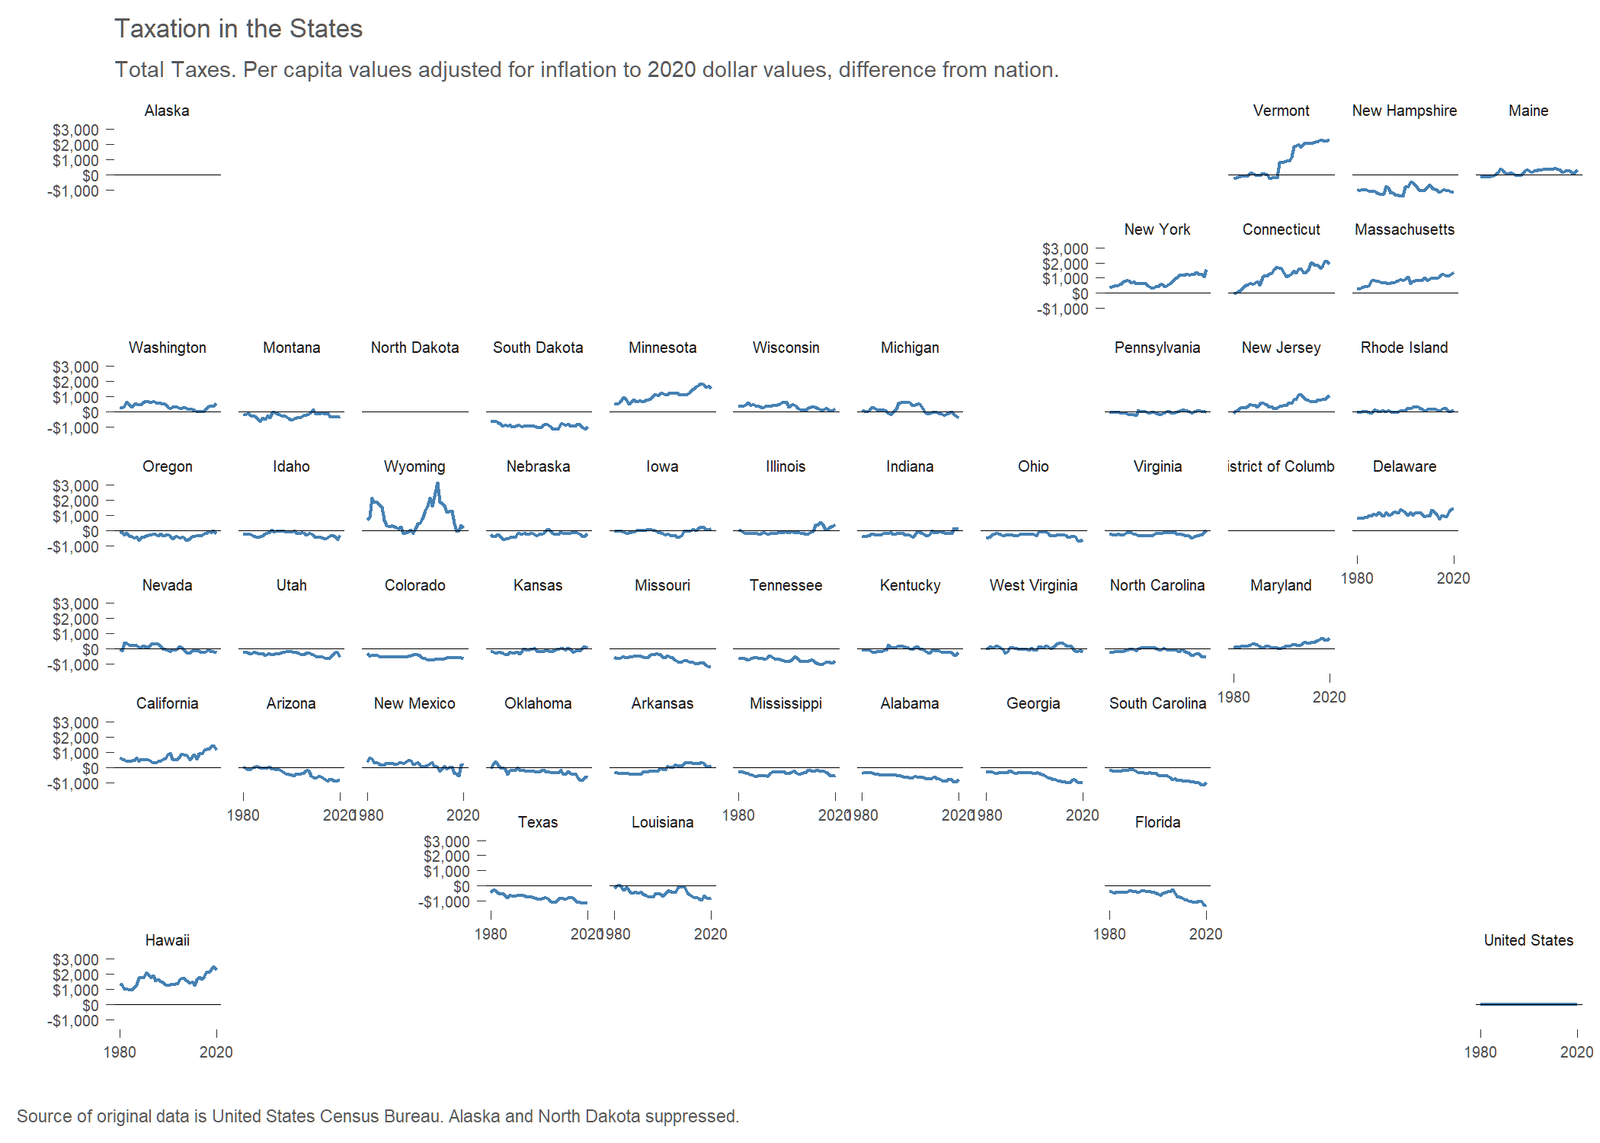
Taxation in the States
How does taxation differ in the states? There can be large differences.
-

Wichita property tax on commercial property: High
An ongoing study reports that property taxes on commercial and industrial property in Wichita are high. In particular, taxes on commercial property in Wichita are among the highest in the nation.
-
Wichita property tax still high on commercial property
An ongoing study reports that property taxes on commercial and industrial property in Wichita are high. In particular, taxes on commercial property in Wichita are among the highest in the nation.
-
Tax collections by the states
An interactive visualization of tax collections by state governments.
-
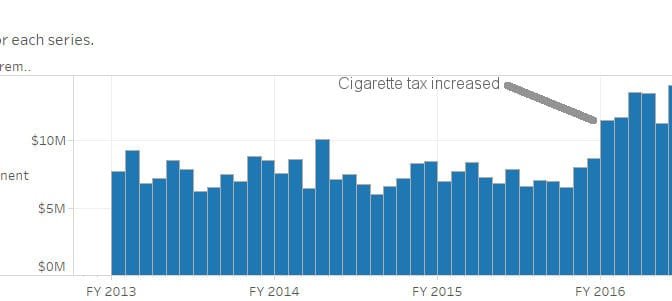
Kansas cigarette tax collections
Kansas raised the cigarette tax. What happened?
-
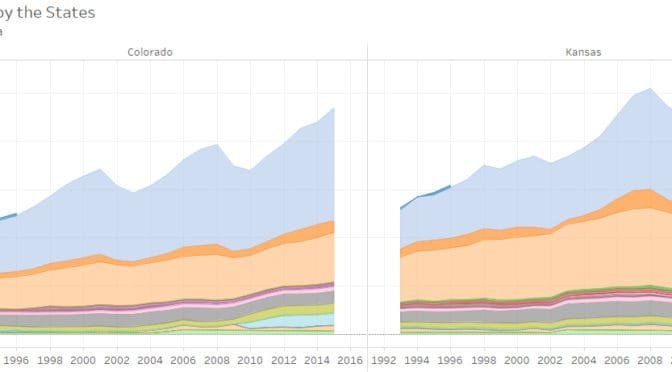
Tax collections by the states
An interactive visualization of tax collections by state governments.
-
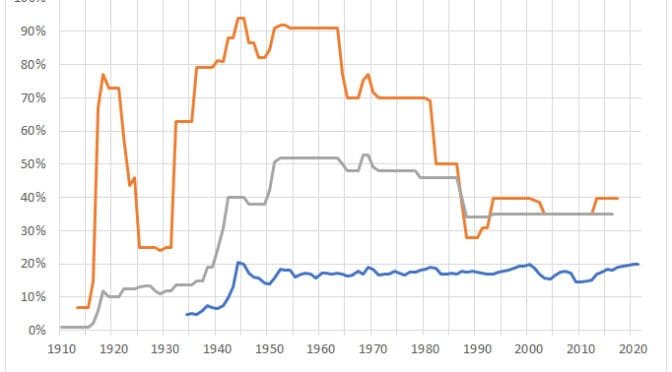
Tax rates and taxes paid
Is there a relationship between marginal tax rates and tax dollars collected?
-

The Wichita Eagle on Kansas sales tax exemptions
The Wichita Eagle editorial board writes an editorial that gives false hope to advocates of more taxation and more spending.