Tag: Economic development
-

Wichita jobs and employment, December 2019
For the Wichita metropolitan area in December 2019, the labor force is up, the number of unemployed persons is down, the unemployment rate is down, and the number of people working is up when compared to the same month one year ago. Seasonal data shows small increases in labor force and jobs from November.
-

Naftzger Park event management agreement ambiguous
The profit-sharing agreement for Naftzger Park event management contains ambiguity that could lead to disputes.
-

Century II resource center
Updated and refreshed: A resource of information about the Century II Performing arts and Convention Center in Wichita.
-

Renderings, at least believable
How believable are architectural renderings of a Ferris wheel and swimming pool in Wichita?
-

Wichita aerospace manufacturing concentration
Wichita leaders want to diversify the area economy. Has there been progress?
-
Wichita to consider tax forgiveness outside policy parameters
The Wichita city council will consider a tax giveaway for an economic development project that does not meet its stated policy.
-

Can Wichita learn from a setback?
What can Wichita learn from the news of layoffs at Spirit and Textron?
-
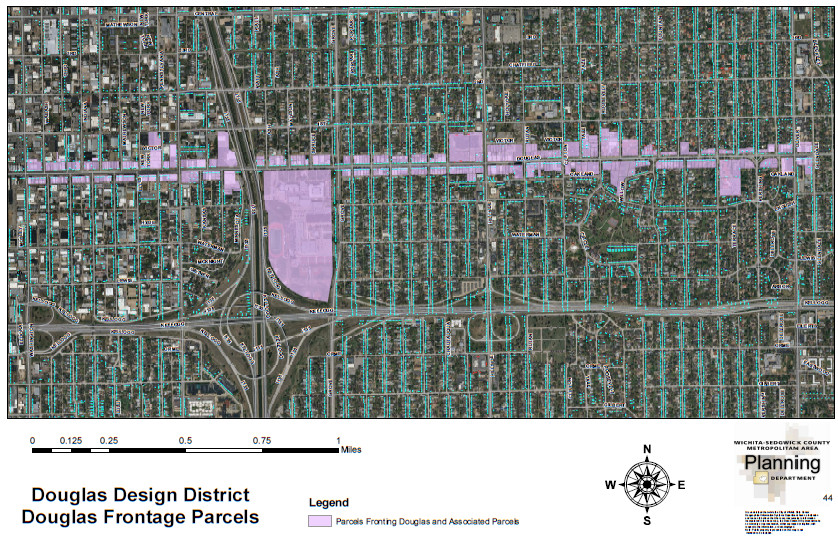
Business improvement district on tap in Wichita
The Douglas Design District seeks to transform from a voluntary business organization to a tax-funded branch of government.
-

Wichita jobs and employment, November 2019
For the Wichita metropolitan area in November 2019, the labor force is up, the number of unemployed persons is down, the unemployment rate is down, and the number of people working is up when compared to the same month one year ago. Seasonal data shows small increases in labor force and jobs from October.
-

Wichita economy grows, and a revision
The Wichita economy grew in 2018, and revised statistics show growth in 2017.
-

Downtown Wichita population is up
New Census Bureau data shows the population growing in downtown Wichita.
-
Downtown Wichita jobs rise
The number of jobs in downtown Wichita rose sharply in 2017.