Tag: Economics
-

Federal revenue and outlays
An interactive visualization of federal government revenue and spending from 1962 to the present.
-

Effects of pandemic on employment in states
The effects of the response to the pandemic vary widely among the states, but federal government employment has been little affected.
-
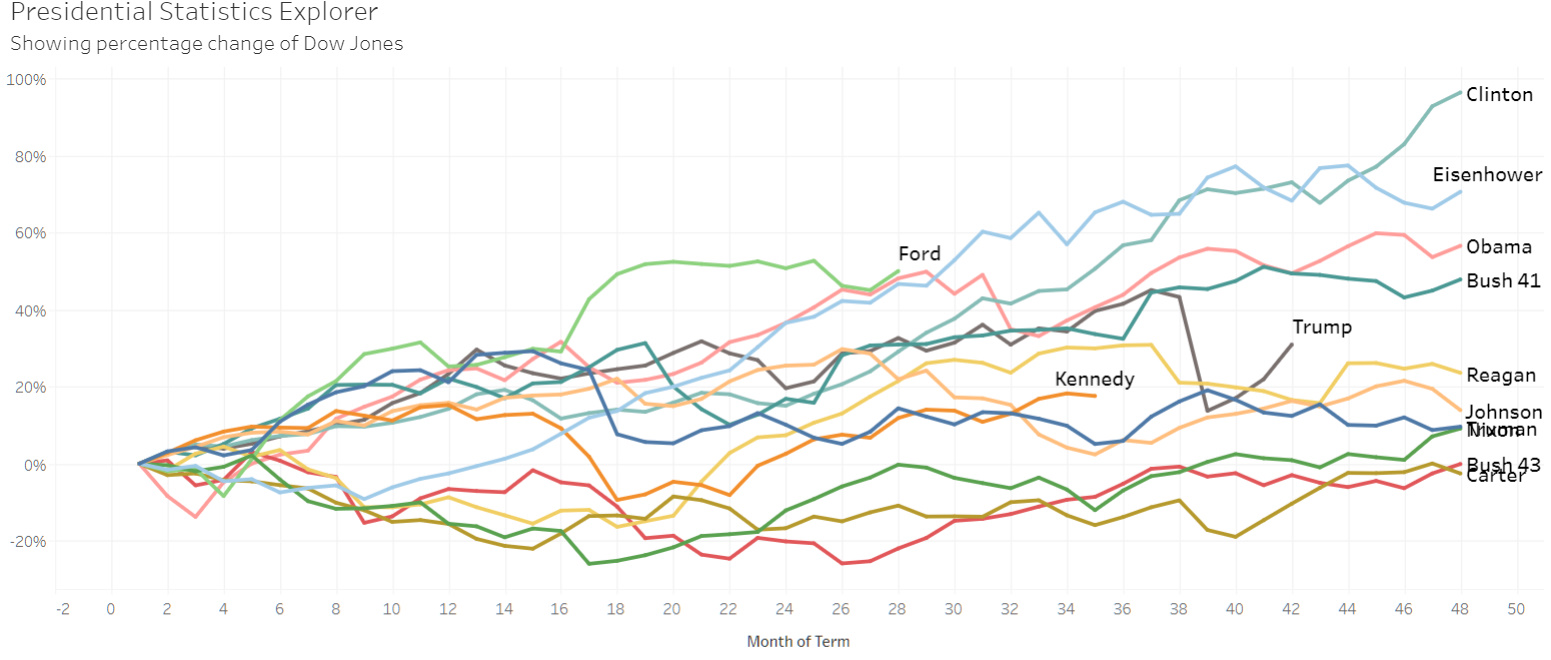
Presidential data explorer
Explore the economic record of presidents, starting with Harry S Truman.
-
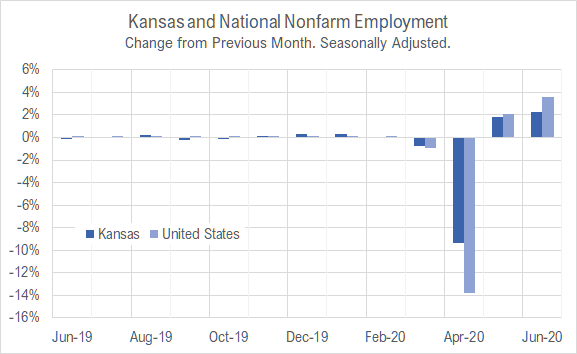
Kansas jobs, June 2020
The employment situation in Kansas continued to improve in June 2020 as the response to the pandemic continued to affect the economy.
-
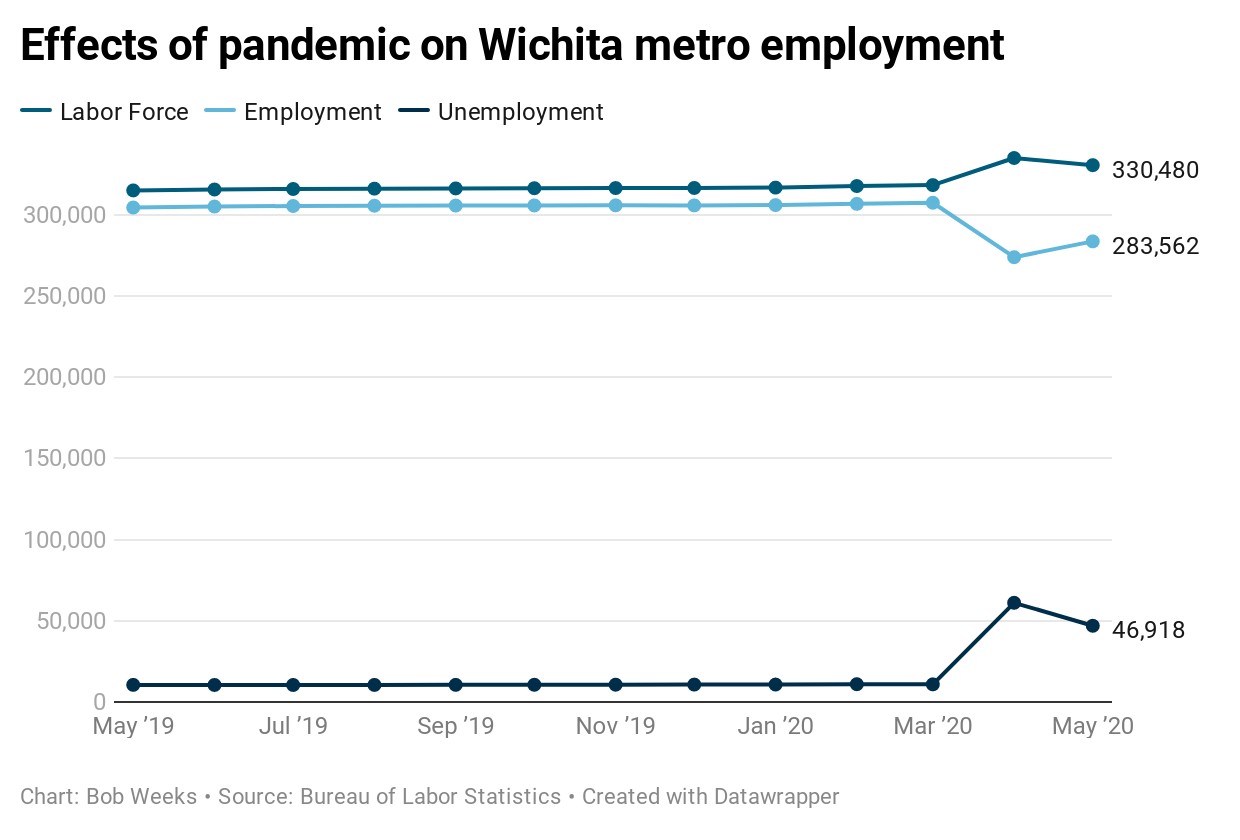
Effects of pandemic on Wichita metro employment
Here is the effect of the pandemic — or rather, the effect of the response to the pandemic — on Wichita metropolitan area employment.
-
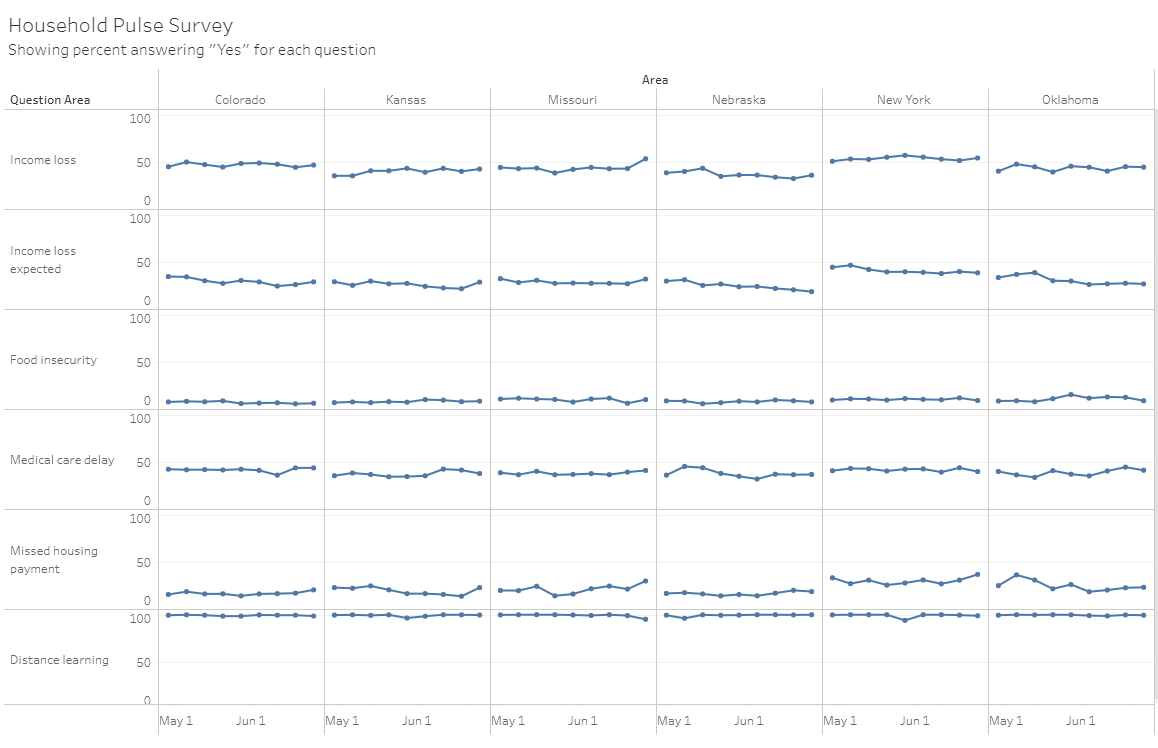
Measuring household experiences during the coronavirus (COVID-19) pandemic
An interactive visualization of household data on the effects of the pandemic.
-

Kansas GDP
In the first quarter of 2020, the Kansas economy contracted at the annual rate of 3.1 percent, compared to 2.1 percent growth in the previous quarter. While GDP fell in all states, Kansas performed relatively well, with only four states contracting less.
-

Presidential jobs explorer
Explore the jobs creation record of presidents, starting with Harry S Truman.
-
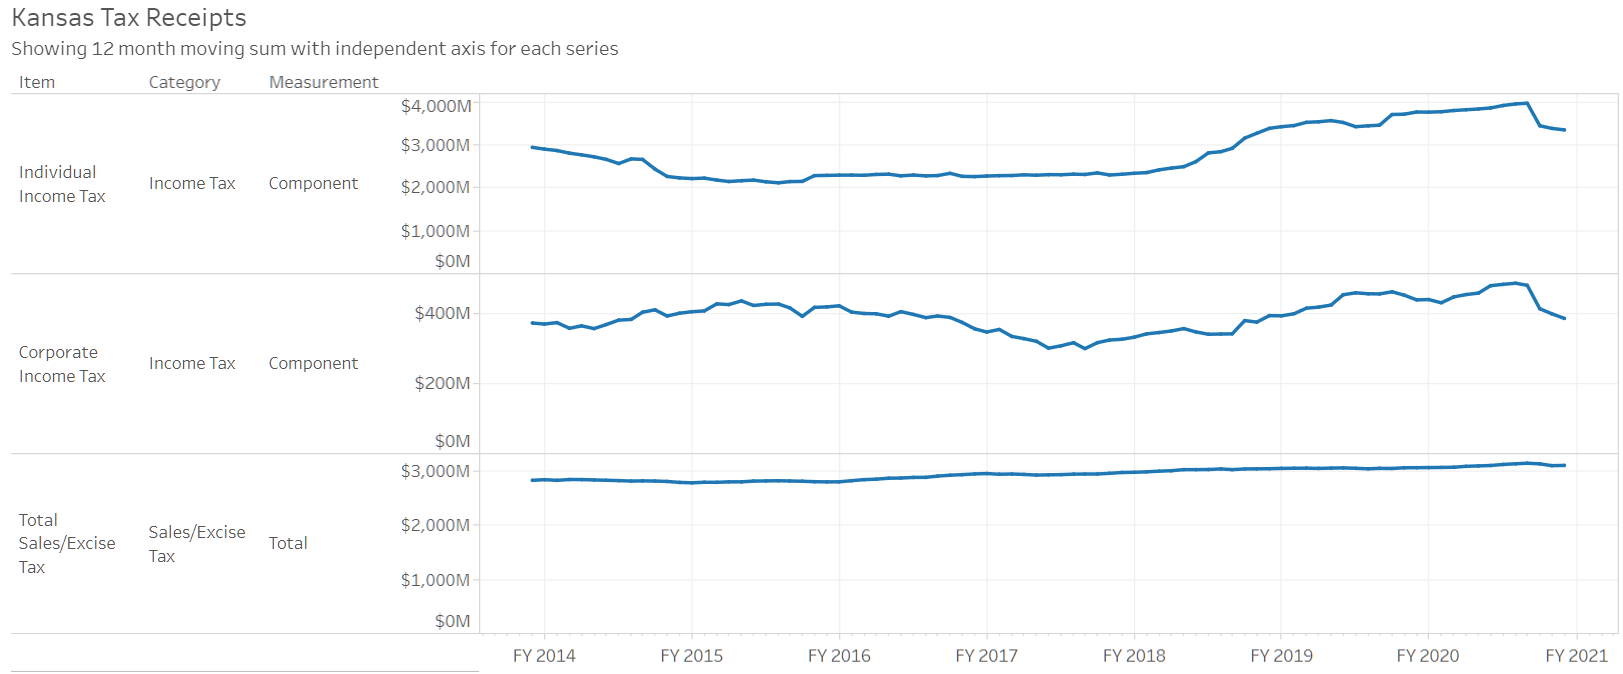
Kansas tax revenue, June 2020
For June 2020, total Kansas tax revenue fell by 4.8 percent from last June. For the just-completed fiscal year 2020, revenue was down by 5.7 percent from the previous year.
-

National employment, June 2020
There is good news in the jobs report for June.
-

Metropolitan employment and labor force
A visualization of employment, labor force, and the unemployment rate for metropolitan areas, now with data through May 2020.
-

Wichita jobs and employment, May 2020
For the Wichita metropolitan area in May 2020, the number of unemployed persons is up, the unemployment rate is up, and the number of people working is down, all by large amounts, when compared to the same month one year ago, but improving from April.