Tag: Economics
-
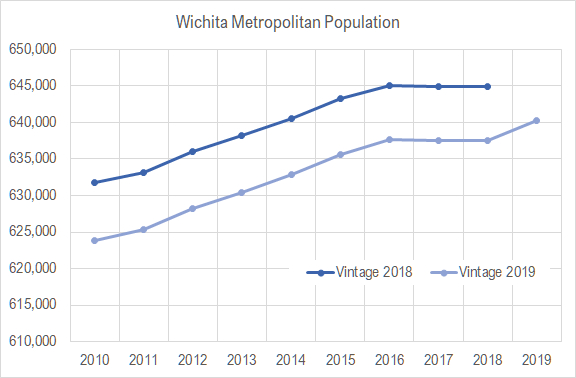
Wichita metro population for 2019
For 2019, the estimated population for the Wichita metropolitan area is up — and also down.
-
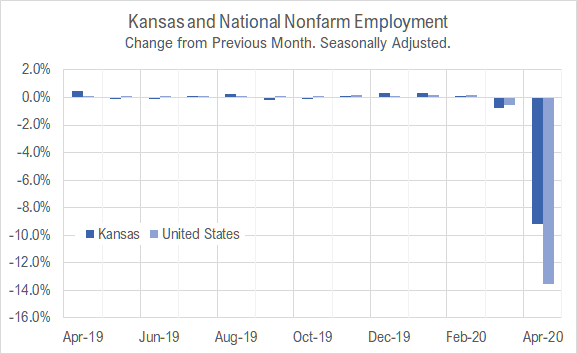
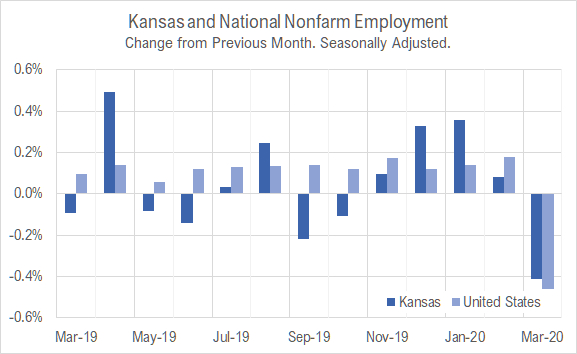
Kansas jobs, April 2020
Employment fell sharply in Kansas in April 2020 as the response to the pandemic unfolded.
-
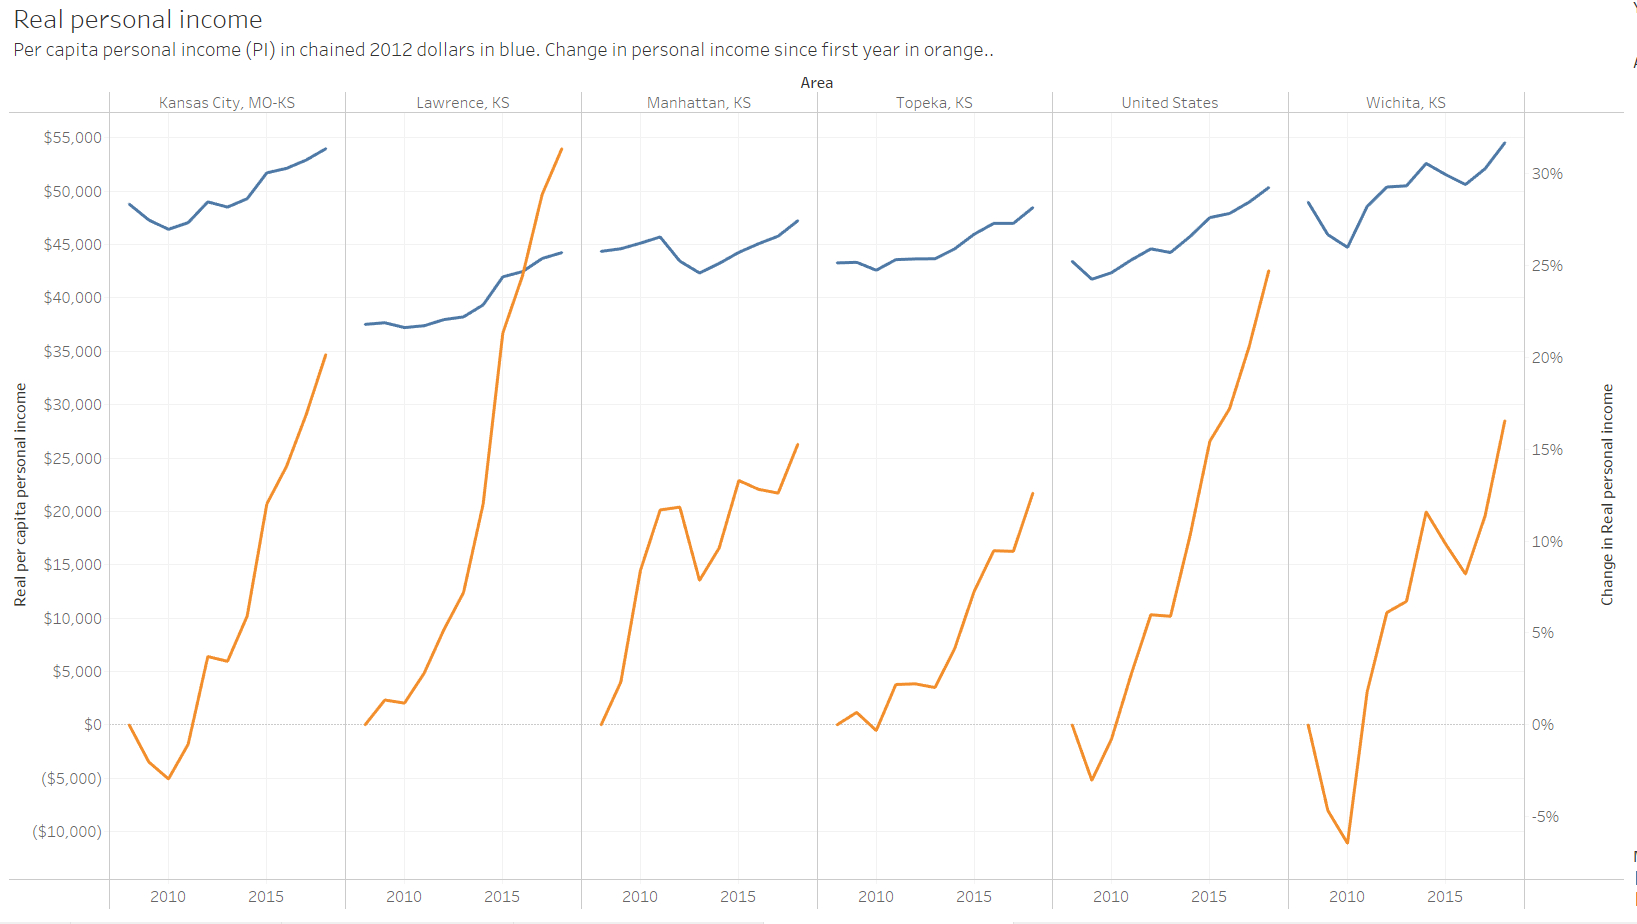
Real personal income in states and metros
When adjusted for regional differences, personal income in Wichita and Kansas is higher than otherwise, but growth is slow.
-
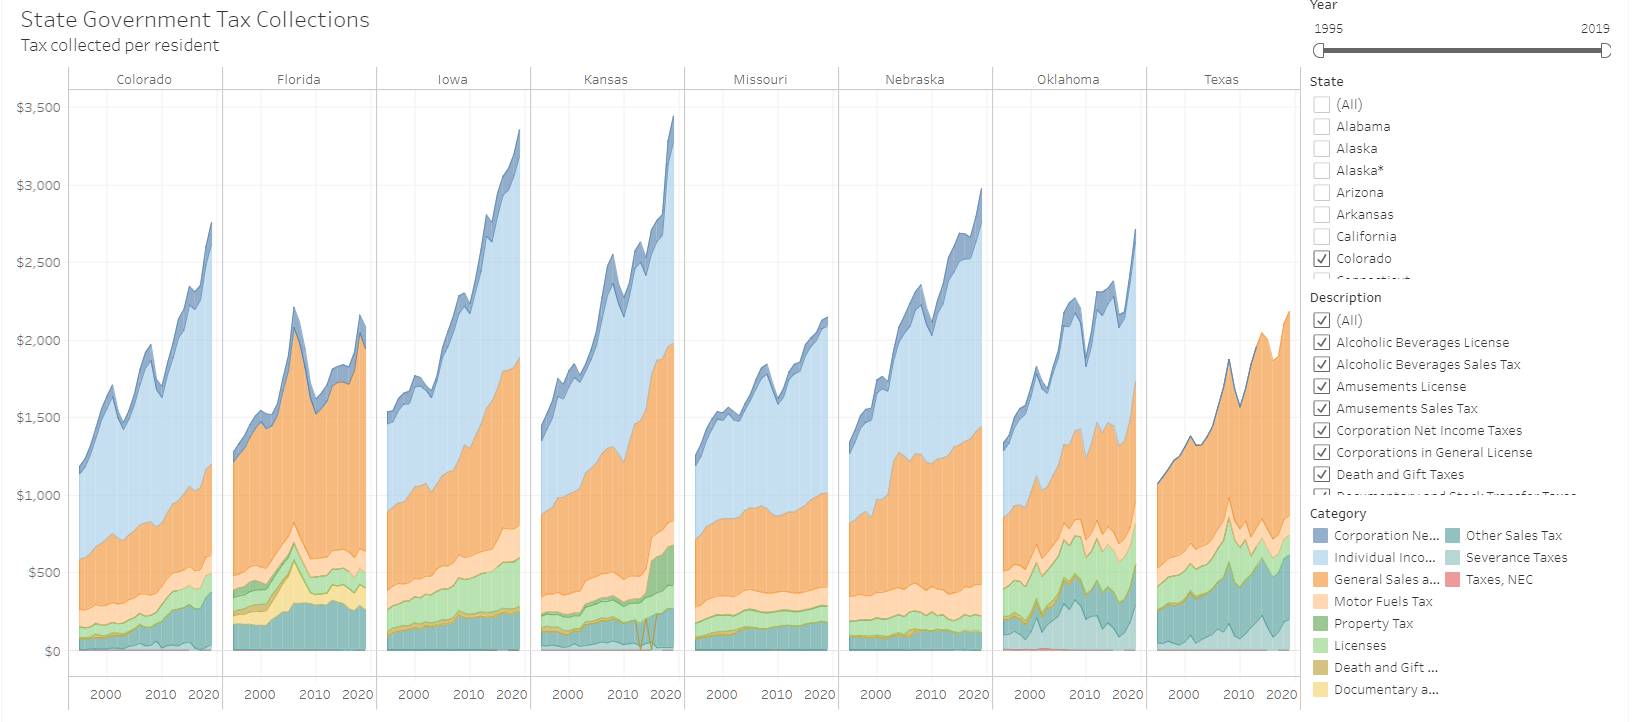
State government tax collections for 2019
Kansas state government tax collections rose to $3,443 per person in 2019, an increase of 5.0 percent from 2018.
-
Kansas tax revenue experiences effects of pandemic response
For April, Kansas retail sales tax collections fell by 8.2 percent from last April, and much income tax revenue is deferred to July.
-

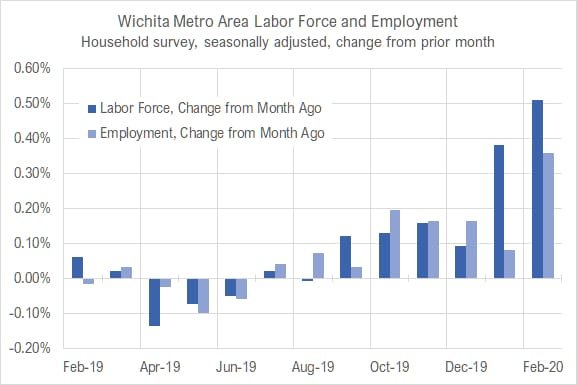
Wichita jobs and employment, March 2020
For the Wichita metropolitan area in March 2020, the labor force is up, the number of unemployed persons is up, the unemployment rate is down, and the number of people working is up when compared to the same month one year ago. Seasonal data shows increases in labor force and jobs from February, with the…
-

Before pandemic, Trump economy created jobs
There is no doubt that the United States economy has created many jobs since Donald J. Trump became president. How does the record compare with the previous administration?
-
Regulation reform could jump-start Kansas economy after COVID
The COVID-19 outbreak has not only posed a severe public health risk, but actions to combat it now risk a global economic collapse, writes Michael Austin.
-
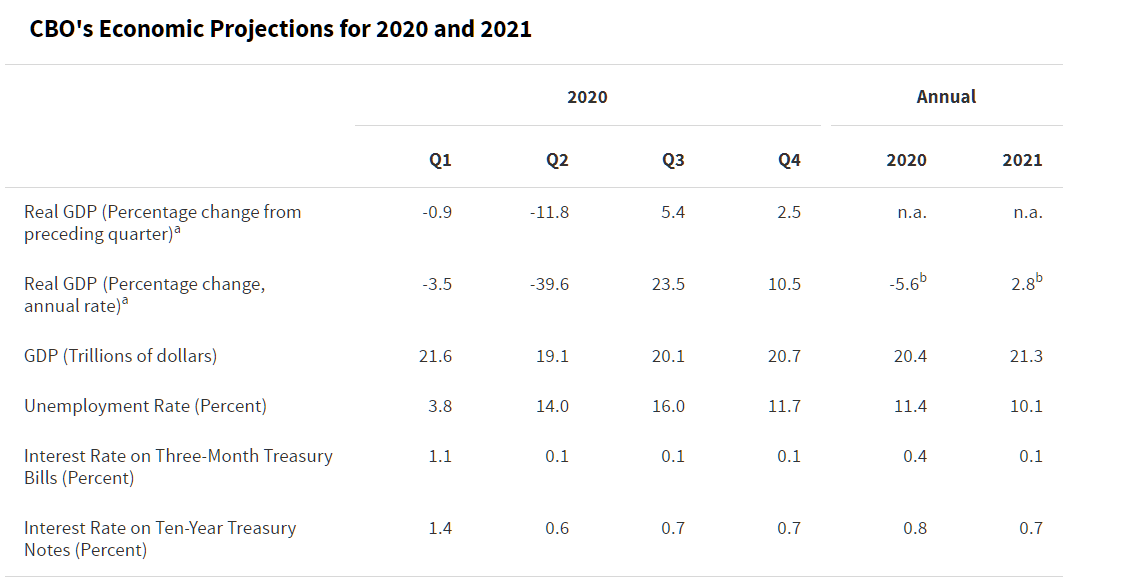
CBO updates projections
Based on post-pandemic conditions, the projections from the Congressional Budget Office for the immediate future are grim, but look better for the future.
-
Kansas jobs, March 2020
Employment fell in Kansas in March 2020 compared to the prior month, but it still higher than last March. It is unclear how the pandemic has affected this data
-

Metropolitan employment and labor force
A visualization of employment, labor force, and unemployment rate for metropolitan areas, now with data through February 2020.
-
Wichita jobs and employment, February 2020
For the Wichita metropolitan area in February 2020, the labor force is up, the number of unemployed persons is up, the unemployment rate is up, and the number of people working is up when compared to the same month one year ago. Seasonal data shows increases in labor force and jobs from January.