Tag: Economics
-
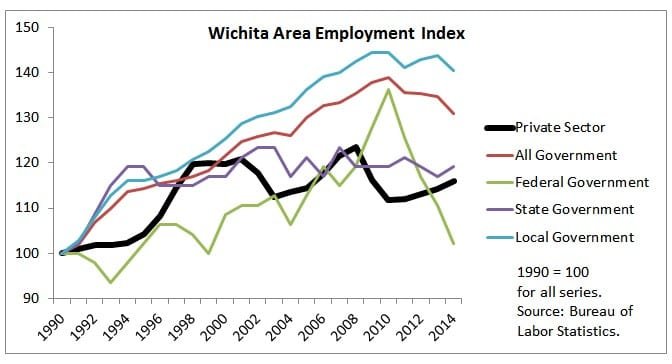
Wichita area job growth
Private sector job growth in the Wichita area is improving, but lags behind local government employment growth.
-
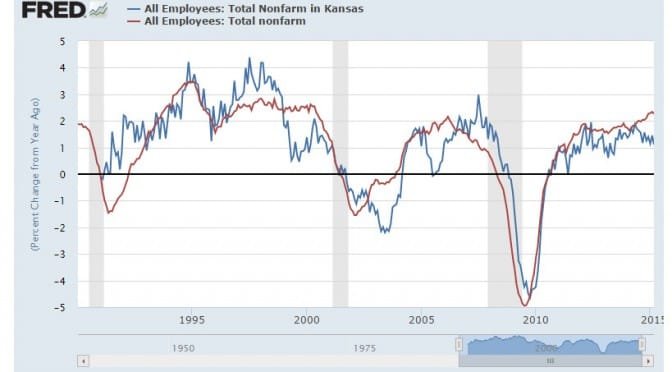
Kansas and U.S. economic dashboard
A collection of charts comparing aspects of Kansas and its economy to the United States.
-

Wichita economic development, the need for reform
An incentives deal for a Wichita company illustrates a capacity problem and the need for reform.
-
‘Trillion Dollar Economists’ presented
Last week Robert E. Litan delivered a very interesting talk to the Wichita Pachyderm Club. The talk was based on his recent book Trillion Dollar Economists: How Economists and Their Ideas have Transformed Business. View video below, or click here to view at YouTube. Video production by Paul Soutar.
-

Intrust Bank Arena loss for 2014 is $5 million
The depreciation expense of Intrust Bank Arena in downtown Wichita recognizes and accounts for the sacrifices of the people of Sedgwick County and its visitors to pay for the arena. But no one wants to talk about this.
-
WichitaLiberty.TV: Wichita Eagle reporting, marijuana laws, and the Kansas economy
The Wichita Eagle prints several stories that ought to cause readers to question the reliability of its newsroom. Wichita voters pass a marijuana law that conflicts state law. Performance of the Kansas economy. Finally, some unexplained results in the way people vote.
-
Populations of the states
An interactive visualization with four views of the populations of the states, 1900 to 2014.
-

Economic indicators for Kansas
During this century the Kansas economy has not kept up with the national economy and most neighboring states.
-
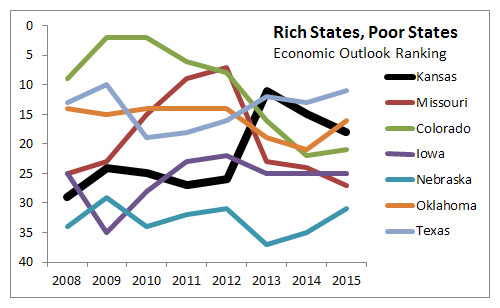
Rich States, Poor States, 2105 edition
In Rich States, Poor States, Kansas continues with middle-of-the-pack performance, and fell in the forward-looking forecast for the second year in a row.
-
The purpose of high tax rates
The purpose of high taxes on the rich is not to get the rich to pay money, it’s to get the middle class to feel better about paying high taxes.
-
STAR bonds in Kansas
The Kansas STAR bonds program provides a mechanism for spending by autopilot, without specific appropriation by the legislature.
-

What we can learn from the piano
The purchase of a piano by a Kansas school district teaches us a lesson. Instead of a system in which schools raise money voluntarily — a system in which customers are happy to buy, donors are happy to give, and schools are grateful to receive — we have strife.