Tag: Featured
-

WichitaLiberty.TV: Senator Jim DeMint and Convention of States
Former United States Senator Jim DeMint joins Karl Peterjohn and Bob Weeks to talk about the Convention of States. David Schneider, regional director for Citizens for Self-Governance also appears.
-

Wichita school revenue
Revenue for the Wichita public school district continues its familiar trend.
-
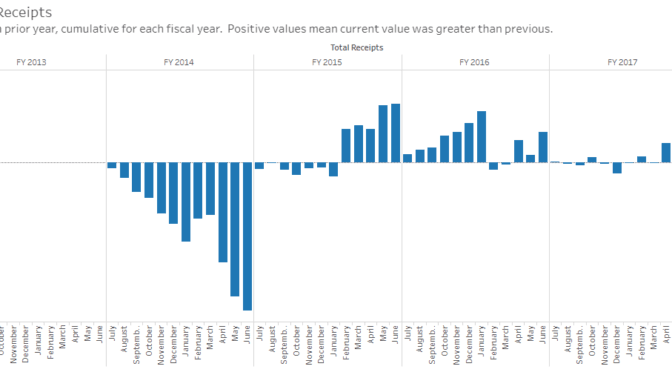
Kansas tax receipts
News about Kansas tax receipts for November 2017, along with an interactive visualization.
-
NOTA a needed voting reform
“None of the Above” voting lets voters cast a meaningful vote, and that can start changing things.
-
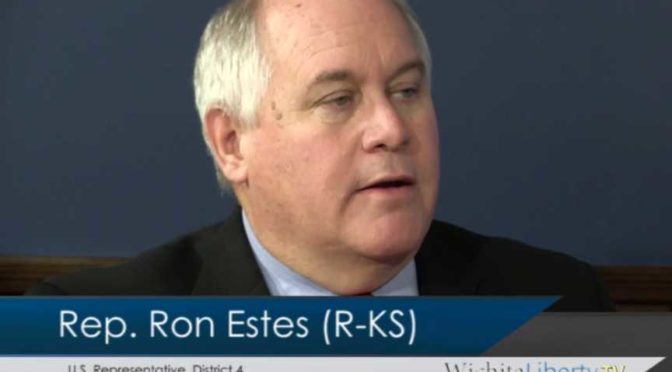
WichitaLiberty:TV: Ron and Susan Estes
United States Representative Ron Estes joins Bob Weeks to talk about the tax bill, his op-ed in the Wall Street Journal, and Susan Estes tells us what Mrs. Smith does when Mr. Smith goes to Washington.
-

PEAK benefits across Kansas
The use of PEAK, a Kansas economic development incentive program, varies widely among counties.
-
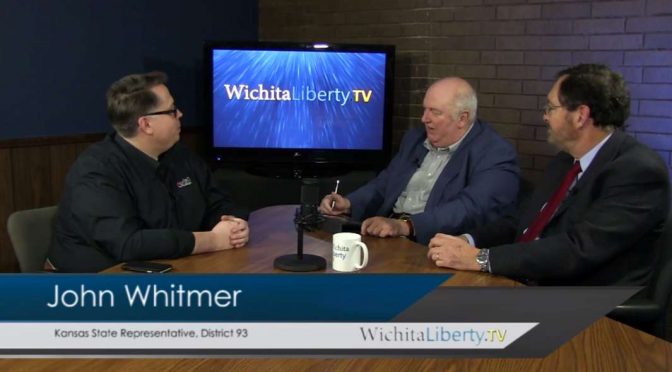
WichitaLiberty.TV: Kansas Representative John Whitmer
Kansas Representative John Whitmer joins Karl Peterjohn and Bob Weeks to discuss current issues in state government, and why he supports Wink Hartman for governor.
-
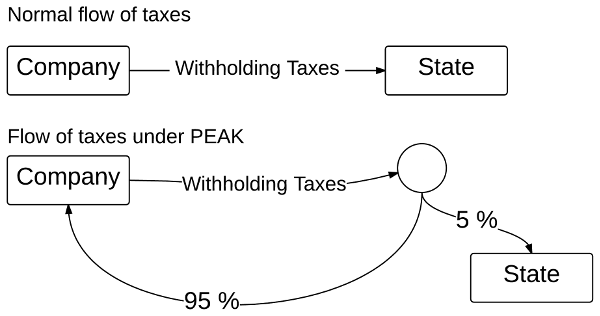
PEAK, or Promoting Employment Across Kansas
PEAK, a Kansas economic development incentive program, redirects employee income taxes back to the employing company.
-
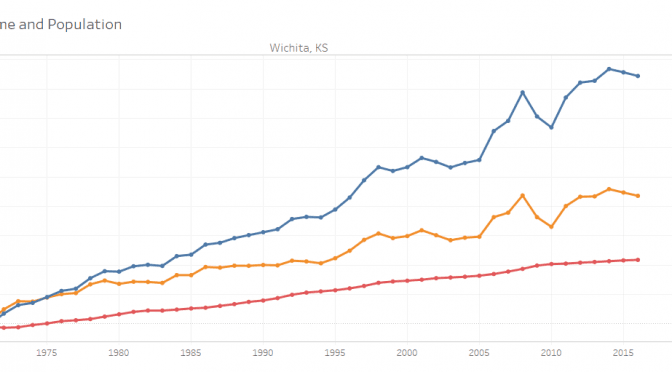
Wichita personal income up, a little
For 2016, personal income in Wichita rose, but is still below 2014 levels.
-
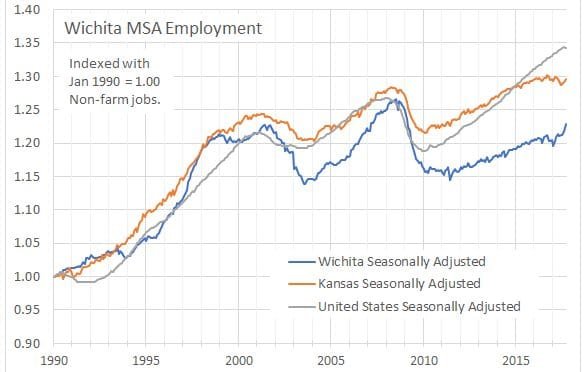
Wichita employment up
Employment in the Wichita metropolitan area is on an upward tick.
-
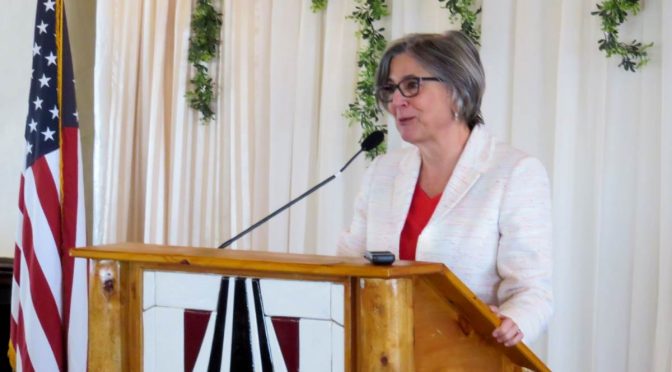
From Pachyderm: Kansas Senate President Susan Wagle
Kansas Senate President Susan Wagle addressed members and guests of the Wichita Pachyderm Club on November 10, 2017. School finance and the Kansas Supreme Court was a prominent topic.
-
WichitaLiberty.TV: Sedgwick County Commissioner Richard Ranzau
Sedgwick County Commissioner Richard Ranzau joins Karl Peterjohn and Bob Weeks to discuss Sedgwick County government issues, including allegations of misconduct by a commission member and the possibility of a Tyson chicken plant.